

Industrial cleaning equipment manufacturer Tennant Company fell short of the market’s revenue expectations in Q2 CY2026 as sales only rose 1.7% year on year to $324 million. On the other hand, the company’s full-year revenue guidance of $1.29 billion at the midpoint came in 1.9% above analysts’ estimates. Its non-GAAP profit of $0.83 per share was 37.6% below analysts’ consensus estimates.
Is now the time to buy Tennant? Find out by accessing our full research report, it’s free.
Tennant (TNC) Q2 CY2026 Highlights:
- Revenue: $324 million vs analyst estimates of $329.6 million (1.7% year-on-year growth, 1.7% miss)
- Adjusted EPS: $0.83 vs analyst expectations of $1.33 (37.6% miss)
- Adjusted EBITDA: $35.3 million vs analyst estimates of $46.73 million (10.9% margin, 24.5% miss)
- The company lifted its revenue guidance for the full year to $1.29 billion at the midpoint from $1.26 billion, a 2.4% increase
- Management lowered its full-year Adjusted EPS guidance to $4.13 at the midpoint, a 17.5% decrease
- EBITDA guidance for the full year is $162.5 million at the midpoint, below analyst estimates of $180 million
- Operating Margin: 4.9%, down from 9.5% in the same quarter last year
- Free Cash Flow was -$400,000, down from $18.6 million in the same quarter last year
- Market Capitalization: $1.49 billion
Company Overview
As the world’s largest manufacturer of autonomous mobile robots, Tennant (NYSE:TNC) designs, manufactures, and sells cleaning products to various sectors.
Revenue Growth
A company’s long-term performance is an indicator of its overall quality. Any business can experience short-term success, but top-performing ones enjoy sustained growth for years. Regrettably, Tennant’s sales grew at a sluggish 2.5% compounded annual growth rate over the last five years. This was below our standards and is a rough starting point for our analysis.
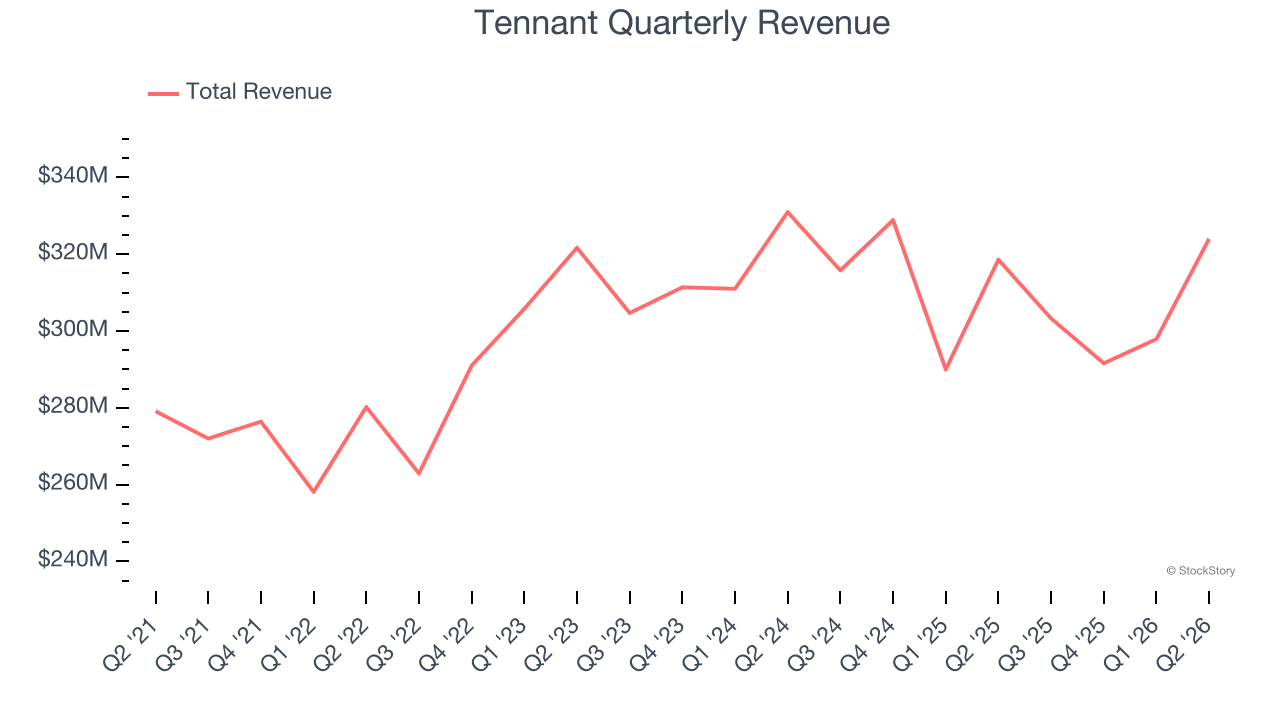
We at StockStory place the most emphasis on long-term growth, but within industrials, a half-decade historical view may miss cycles, industry trends, or a company capitalizing on catalysts such as a new contract win or a successful product line. Tennant’s performance shows it grew in the past but relinquished its gains over the last two years, as its revenue fell by 1.7% annually. 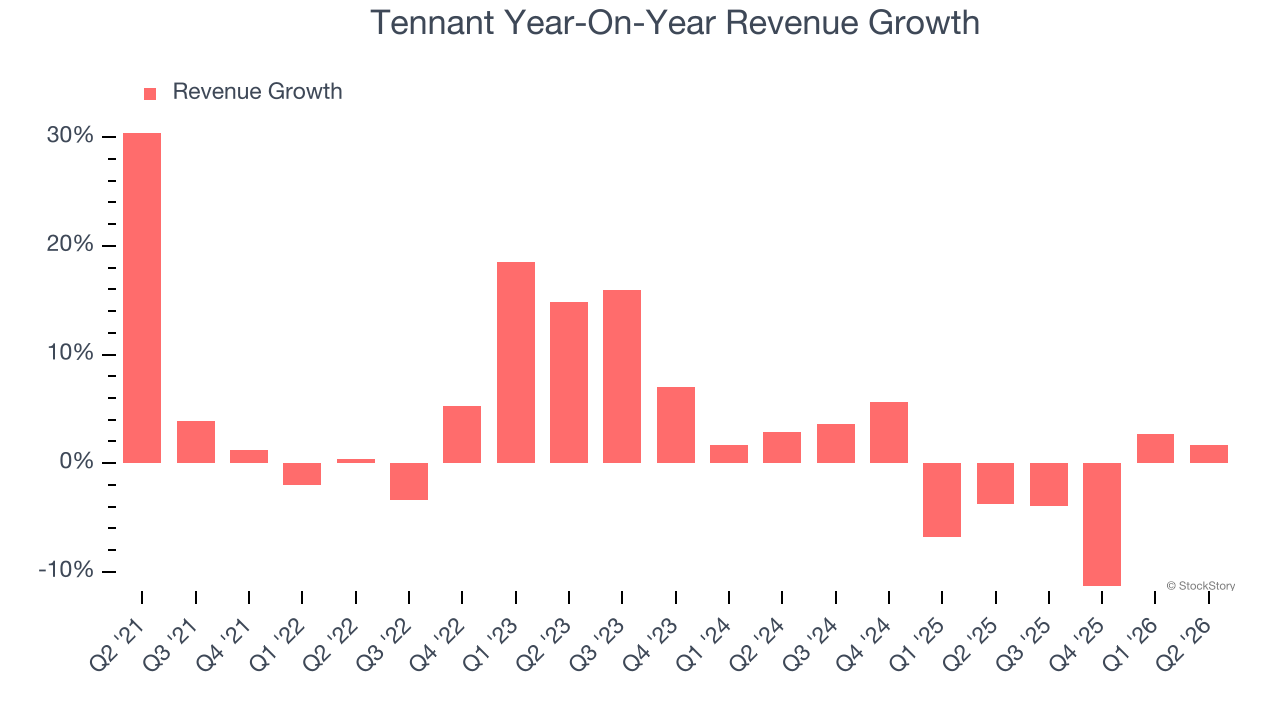
This quarter, Tennant’s revenue grew by 1.7% year on year to $324 million, falling short of Wall Street’s estimates.
Looking ahead, sell-side analysts expect revenue to grow 6.5% over the next 12 months. While this projection suggests its newer products and services will spur better top-line performance, it is still below the sector average.
ALSO WORTH WATCHING: Nvidia’s Quiet Partner. Nvidia’s chips cost a hundred grand. The connectors that make them work cost even more. One company makes them all.
Every AI server needs specialized infrastructure the chip companies don’t make. High-speed cables. Power connectors. Thermal sensors. This 90-year-old company built a monopoly on it. The AI boom just started. This stock is still flying under the radar. Claim The Stock Ticker Here for FREE.
Operating Margin
Tennant has done a decent job managing its cost base over the last five years. The company has produced an average operating margin of 8.1%, higher than the broader industrials sector.
Looking at the trend in its profitability, Tennant’s operating margin decreased by 3.3 percentage points over the last five years. This raises questions about the company’s expense base because its revenue growth should have given it leverage on its fixed costs, resulting in better economies of scale and profitability.
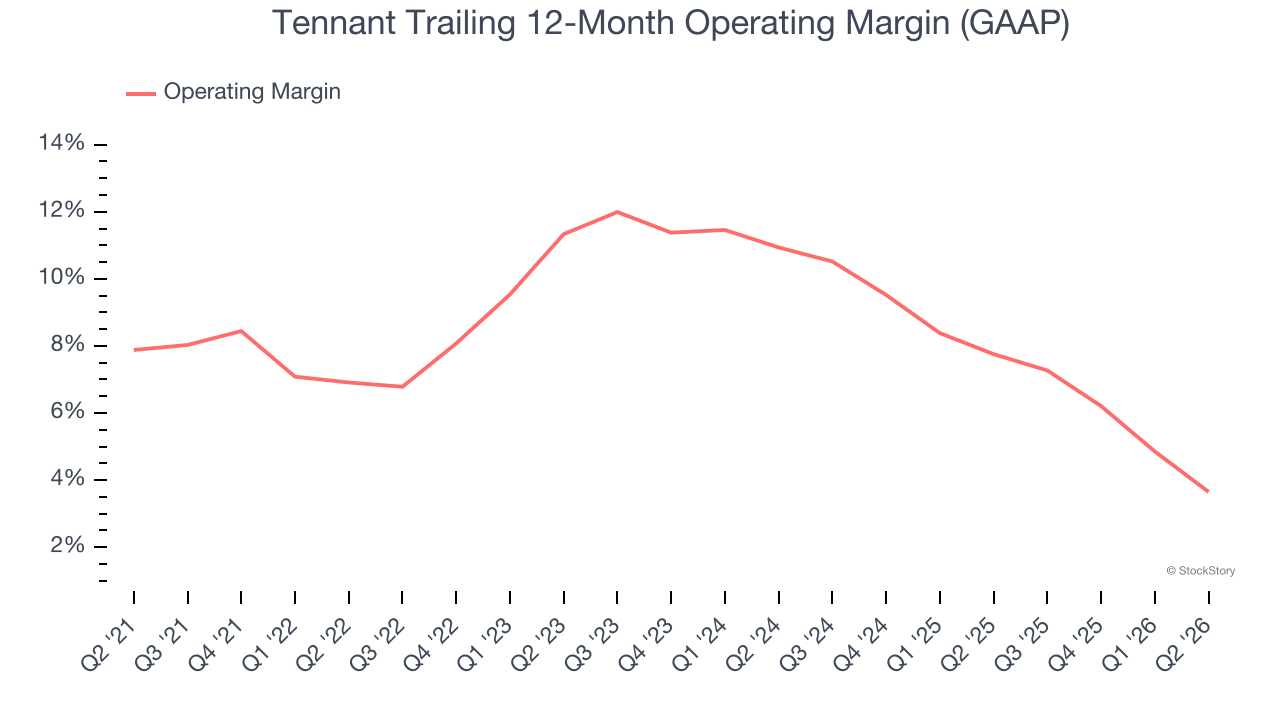
In Q2, Tennant generated an operating margin profit margin of 4.9%, down 4.6 percentage points year on year. Since Tennant’s operating margin decreased more than its gross margin, we can assume it was less efficient because expenses such as marketing, R&D, and administrative overhead increased.
Earnings Per Share
We track the long-term change in earnings per share (EPS) for the same reason as long-term revenue growth. Compared to revenue, however, EPS highlights whether a company’s growth is profitable.
Sadly for Tennant, its EPS declined by 2.1% annually over the last five years while its revenue grew by 2.5%. This tells us the company became less profitable on a per-share basis as it expanded due to non-fundamental factors such as interest expenses and taxes.
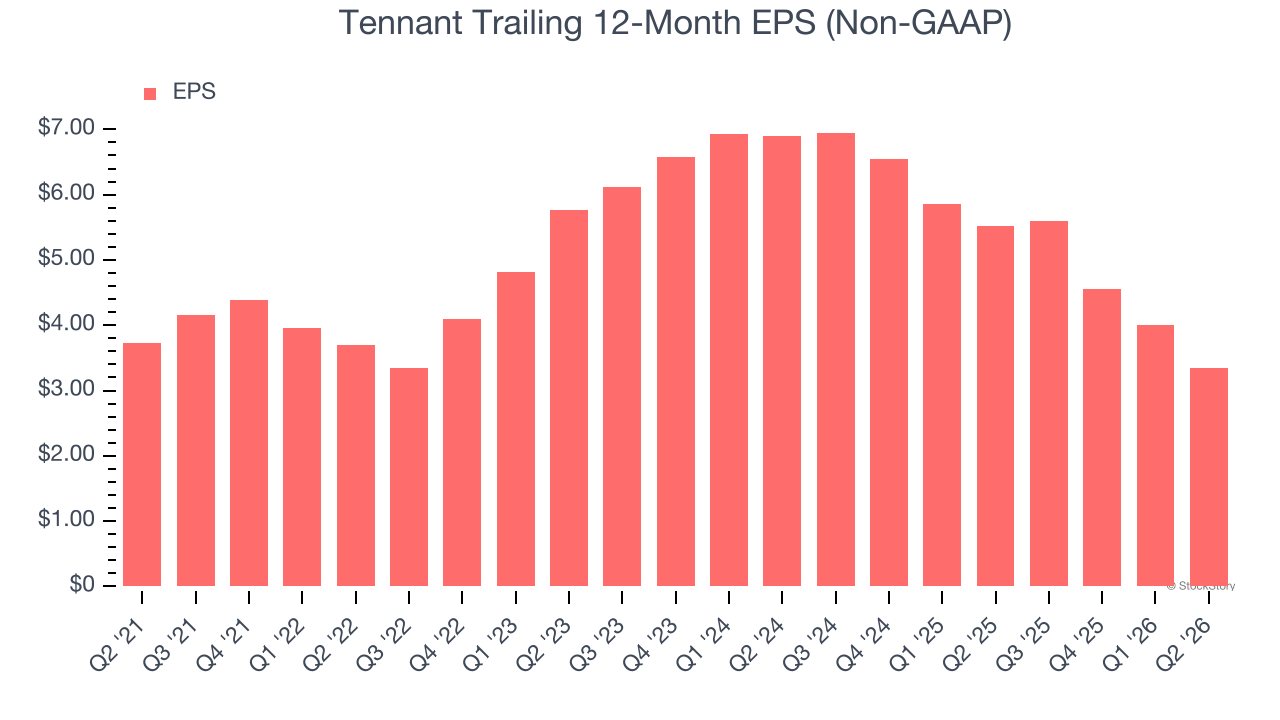
Diving into the nuances of Tennant’s earnings can give us a better understanding of its performance. As we mentioned earlier, Tennant’s operating margin declined by 3.3 percentage points over the last five years. This was the most relevant factor (aside from the revenue impact) behind its lower earnings; interest expenses and taxes can also affect EPS but don’t tell us as much about a company’s fundamentals.
Like with revenue, we analyze EPS over a more recent period because it can provide insight into an emerging theme or development for the business.
For Tennant, its two-year annual EPS declines of 30.3% show it’s continued to underperform. These results were bad no matter how you slice the data.
In Q2, Tennant reported adjusted EPS of $0.83, down from $1.49 in the same quarter last year. This print missed analysts’ estimates. Over the next 12 months, Wall Street expects Tennant’s full-year EPS to grow 77.7% from $3.35 to $5.95.
Key Takeaways from Tennant’s Q2 Results
It was great to see Tennant’s full-year revenue guidance top analysts’ expectations. On the other hand, its full-year EBITDA guidance missed and its EBITDA fell short of Wall Street’s estimates. Overall, this was a softer quarter. The stock traded down 13.8% to $75.16 immediately following the results.
Tennant’s latest earnings report disappointed. One quarter doesn’t define a company’s quality, so let’s explore whether the stock is a buy at the current price. If you’re making that decision, you should consider the bigger picture of valuation, business qualities, as well as the latest earnings. We cover that in our actionable full research report which you can read here (it’s free).