

Fast-food pizza chain Papa John’s (NASDAQ:PZZA) met Wall Street’s revenue expectations in Q2 CY2026, but sales fell by 8.8% year on year to $482.4 million. Its non-GAAP profit of $0.46 per share was in line with analysts’ consensus estimates.
Is now the time to buy Papa John's? Find out by accessing our full research report, it’s free.
Papa John's (PZZA) Q2 CY2026 Highlights:
- Revenue: $482.4 million vs analyst estimates of $480.9 million (8.8% year-on-year decline, in line)
- Adjusted EPS: $0.46 vs analyst estimates of $0.45 (in line)
- Adjusted EBITDA: $52.72 million vs analyst estimates of $53.63 million (10.9% margin, 1.7% miss)
- EBITDA guidance for the full year is $185 million at the midpoint, below analyst estimates of $200.2 million
- Operating Margin: 4.8%, in line with the same quarter last year
- Free Cash Flow Margin: 3.3%, similar to the same quarter last year
- Locations: 5,978 at quarter end, down from 5,989 in the same quarter last year
- Same-Store Sales fell 5.7% year on year (1.6% in the same quarter last year)
- Market Capitalization: $978.8 million
Company Overview
Founded by the eclectic John “Papa John” Schnatter, Papa John’s (NASDAQ:PZZA) is a globally recognized pizza delivery and carryout chain known for “better ingredients” and “better pizza”.
Revenue Growth
A company’s long-term sales performance can indicate its overall quality. Any business can have short-term success, but a top-tier one grows for years.
With $1.97 billion in revenue over the past 12 months, Papa John's is a mid-sized restaurant chain, which sometimes brings disadvantages compared to larger competitors benefiting from better brand awareness and economies of scale.
As you can see below, Papa John's grew its sales at a sluggish 3.4% compounded annual growth rate over the last seven years.
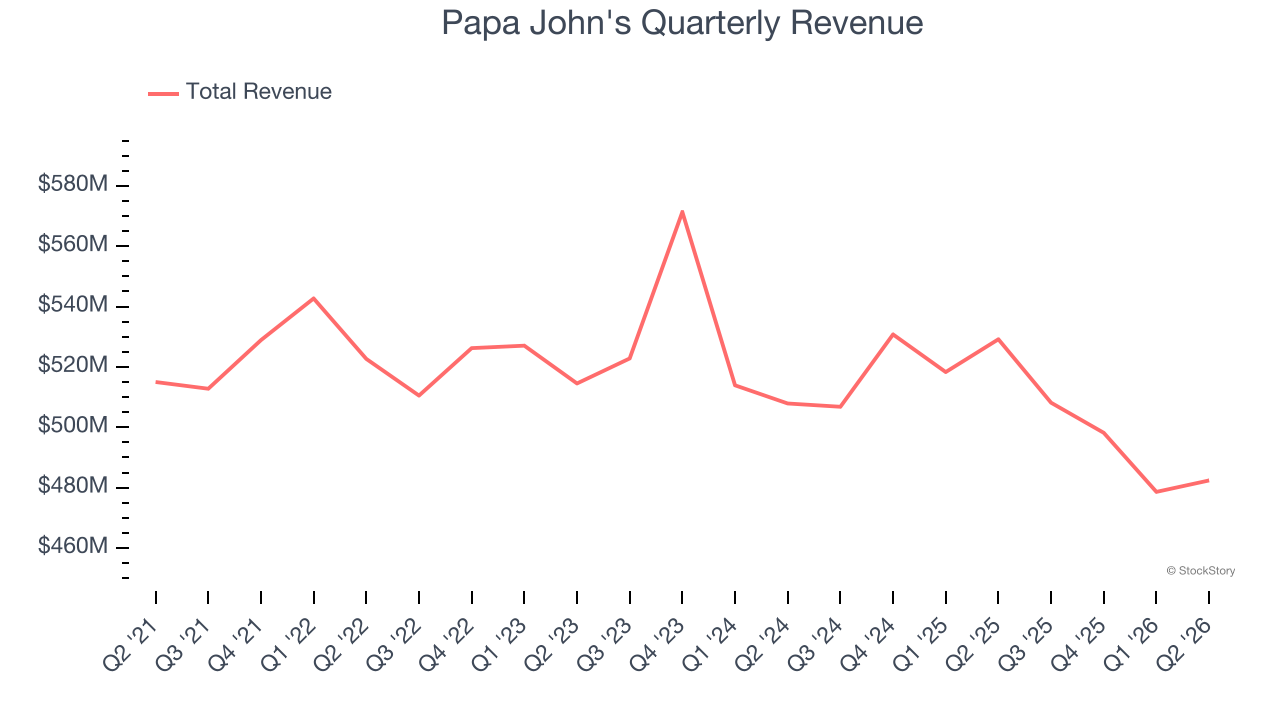
This quarter, Papa John's reported a rather uninspiring 8.8% year-on-year revenue decline to $482.4 million of revenue, in line with Wall Street’s estimates.
Looking ahead, sell-side analysts expect revenue to decline by 3.8% over the next 12 months, a deceleration versus the last seven years. This projection is underwhelming and suggests its menu offerings will face some demand challenges.
ALSO WORTH WATCHING: Nvidia’s Quiet Partner. Nvidia’s chips cost a hundred grand. The connectors that make them work cost even more. One company makes them all.
Every AI server needs specialized infrastructure the chip companies don’t make. High-speed cables. Power connectors. Thermal sensors. This 90-year-old company built a monopoly on it. The AI boom just started. This stock is still flying under the radar. Claim The Stock Ticker Here for FREE.
Restaurant Performance
Number of Restaurants
A restaurant chain’s total number of dining locations often determines how much revenue it can generate.
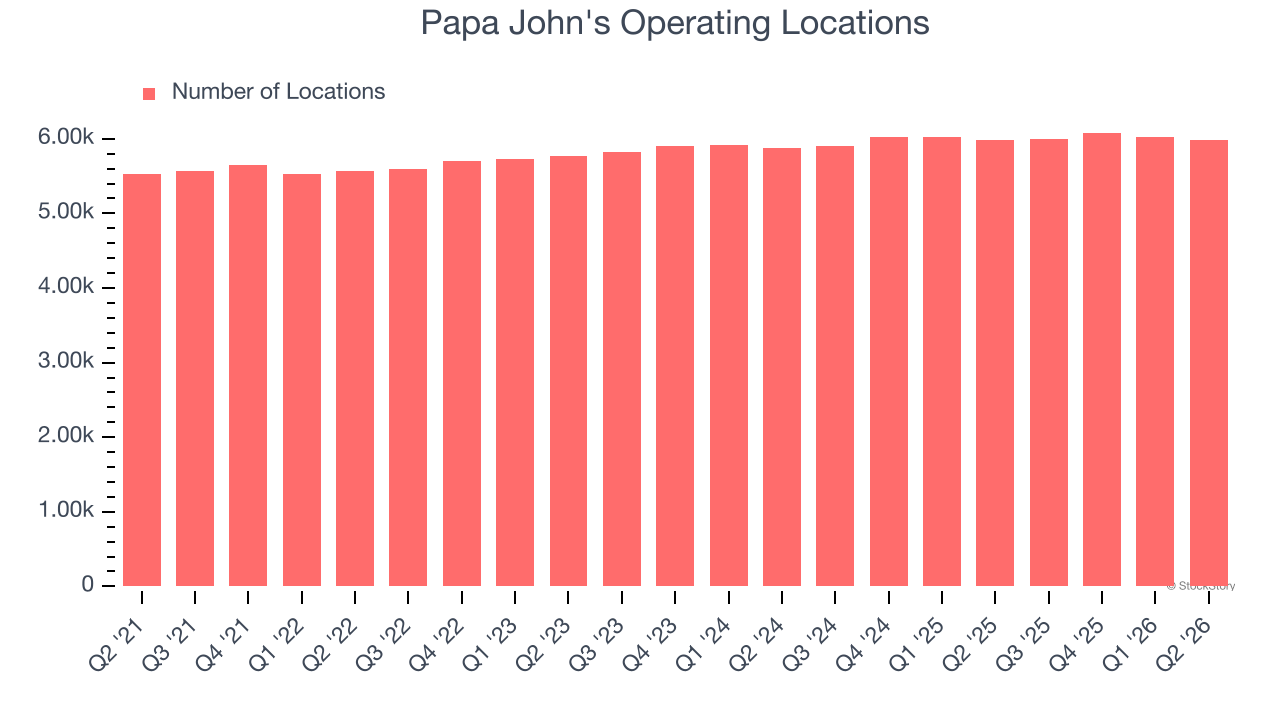
Papa John's operated 5,978 locations in the latest quarter. It has generally opened new restaurants over the last two years and averaged 1.2% annual growth, faster than the broader restaurant sector. Furthermore, one dynamic making expansion more seamless is the company’s franchise model, where franchisees are primarily responsible for opening new restaurants while Papa John's provides support.
When a chain opens new restaurants, it usually means it’s investing for growth because there’s healthy demand for its meals and there are markets where its concepts have few or no locations.
Same-Store Sales
A company’s restaurant base only paints one part of the picture. When demand is high, it makes sense to open more. But when demand is low, it’s prudent to close some locations and use the money in other ways. Same-store sales gives us insight into this topic because it measures organic growth at restaurants open for at least a year.
Papa John’s demand has been shrinking over the last two years as its same-store sales have averaged 2.5% annual declines. This performance is concerning - it shows Papa John's artificially boosts its revenue by building new restaurants. We’d like to see a company’s same-store sales rise before it takes on the costly, capital-intensive endeavor of expanding its restaurant base.
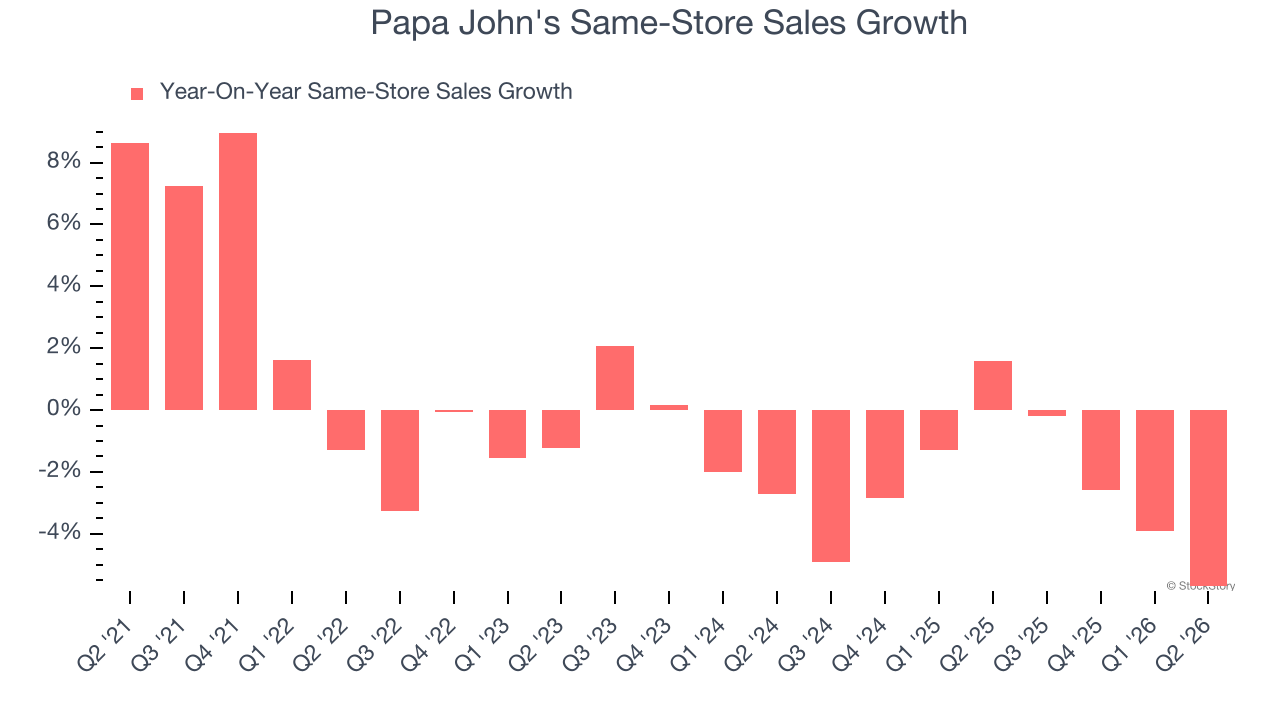
In the latest quarter, Papa John’s same-store sales fell by 5.7% year on year. This decrease represents a further deceleration from its historical levels. We hope the business can get back on track.
Key Takeaways from Papa John’s Q2 Results
Papa John's only met analysts’ revenue expectations this quarter. On the negative side, its full-year EBITDA guidance missed and its same-store sales fell slightly short of Wall Street’s estimates. Overall, this was a softer quarter. The stock traded down 7.7% to $27.47 immediately after reporting.
Papa John’s latest earnings report disappointed. One quarter doesn’t define a company’s quality, so let’s explore whether the stock is a buy at the current price. The latest quarter does matter, but not nearly as much as longer-term fundamentals and valuation, when deciding if the stock is a buy. We cover that in our actionable full research report which you can read here (it’s free).