

Oil and gas producer Occidental Petroleum (NYSE:OXY) reported revenue ahead of Wall Street’s expectations in Q2 CY2026, with sales up 52.1% year on year to $8.07 billion. Its non-GAAP profit of $2.40 per share was 29.8% above analysts’ consensus estimates.
Is now the time to buy Occidental Petroleum? Find out by accessing our full research report, it’s free.
Occidental Petroleum (OXY) Q2 CY2026 Highlights:
- Revenue: $8.07 billion vs analyst estimates of $7.22 billion (52.1% year-on-year growth, 11.7% beat)
- Adjusted EPS: $2.40 vs analyst estimates of $1.85 (29.8% beat)
- Operating Margin: 51.9%, up from 15.8% in the same quarter last year
- Free Cash Flow Margin: 63.1%, up from 23.7% in the same quarter last year
- Market Capitalization: $54.79 billion
Company Overview
Backed by Warren Buffett's Berkshire Hathaway as a major shareholder, Occidental Petroleum (NYSE:OXY) explores for, develops, and produces oil, natural gas liquids, and natural gas, primarily in the United States and Middle East.
Revenue Growth
A company’s long-term performance can give signals about its business quality. Even a bad business, especially in a cyclical industry, can shine for a year or so, but a top-tier one should exhibit resilience through cycles. Unfortunately, Occidental Petroleum’s 6.2% annualized revenue growth over the last five years was sluggish. This wasn’t a great result compared to the rest of the energy upstream and integrated energy sector, but there are still things to like about Occidental Petroleum.
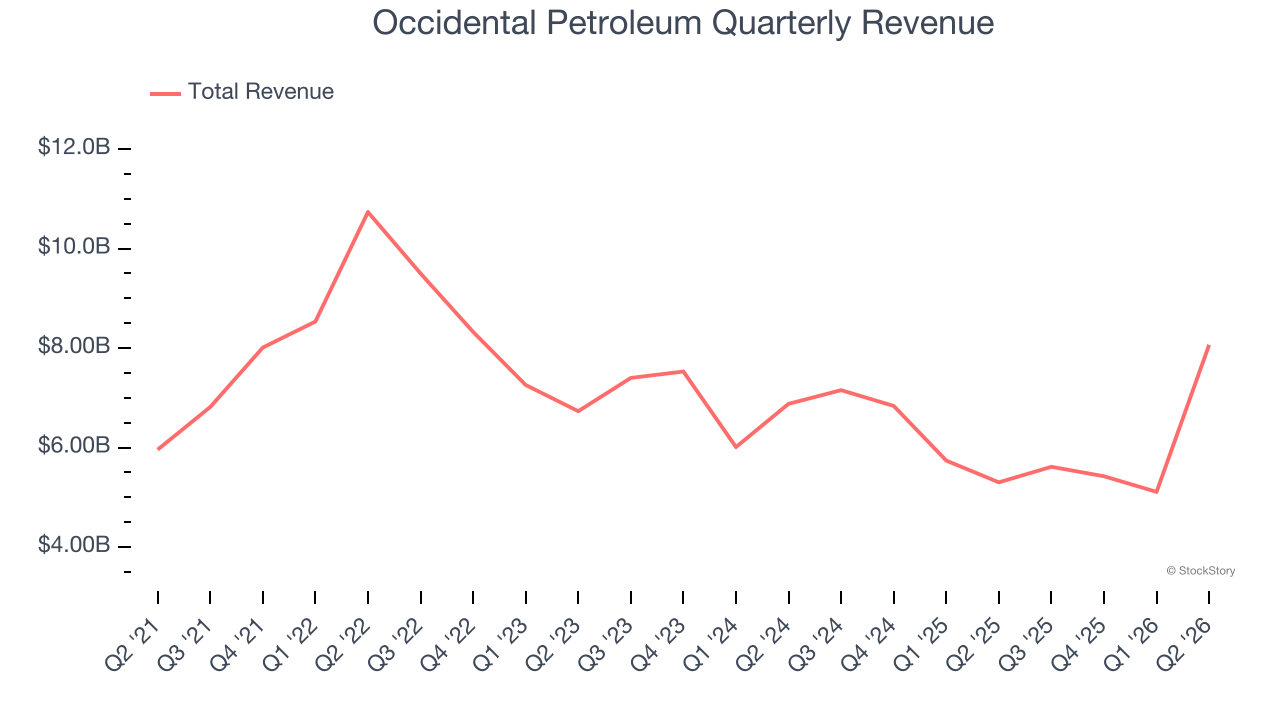
Energy cycles can be long enough that a single five-year period can still reflect one price environment, which is why an additional, decade-long view can help capture through-cycle performance. Occidental Petroleum’s annualized revenue growth of 8.3% over the last ten years is above its five-year trend.
This quarter, Occidental Petroleum reported magnificent year-on-year revenue growth of 52.1%, and its $8.07 billion of revenue beat Wall Street’s estimates by 11.7%.
WHILE YOU’RE HERE: The Next Palantir? One satellite company captures images of every point on Earth. Every single day. The Pentagon wants it. Hedge funds are using it to beat earnings. You’ve probably never heard of it.
This is what the early days of Palantir looked like before it became a giant. Same playbook. Different technology. If you missed Palantir, you need to see this. Claim The Stock Ticker for Free HERE.
Adjusted EBITDA Margin
Adjusted EBITDA margin is an important measure of profitability for the sector and accounts for the gross margins and operating costs mentioned previously. Unlike operating margin, it is not distorted by accounting conventions around reserves, drilling costs, and assumptions on commodity consumption from the well or basin. Adjusted EBITDA highlights the economic reality of how much cash the rock produces before the capital structure (debt service) and the drilling budget (capex) are considered.
Occidental Petroleum has been a well-oiled machine over the last five years. It demonstrated elite profitability for an upstream and integrated energy business, boasting an average EBITDA margin of 57.1%.
Looking at the trend in its profitability, Occidental Petroleum’s EBITDA margin rose by 5.6 percentage points over the last year, as its sales growth gave it operating leverage.
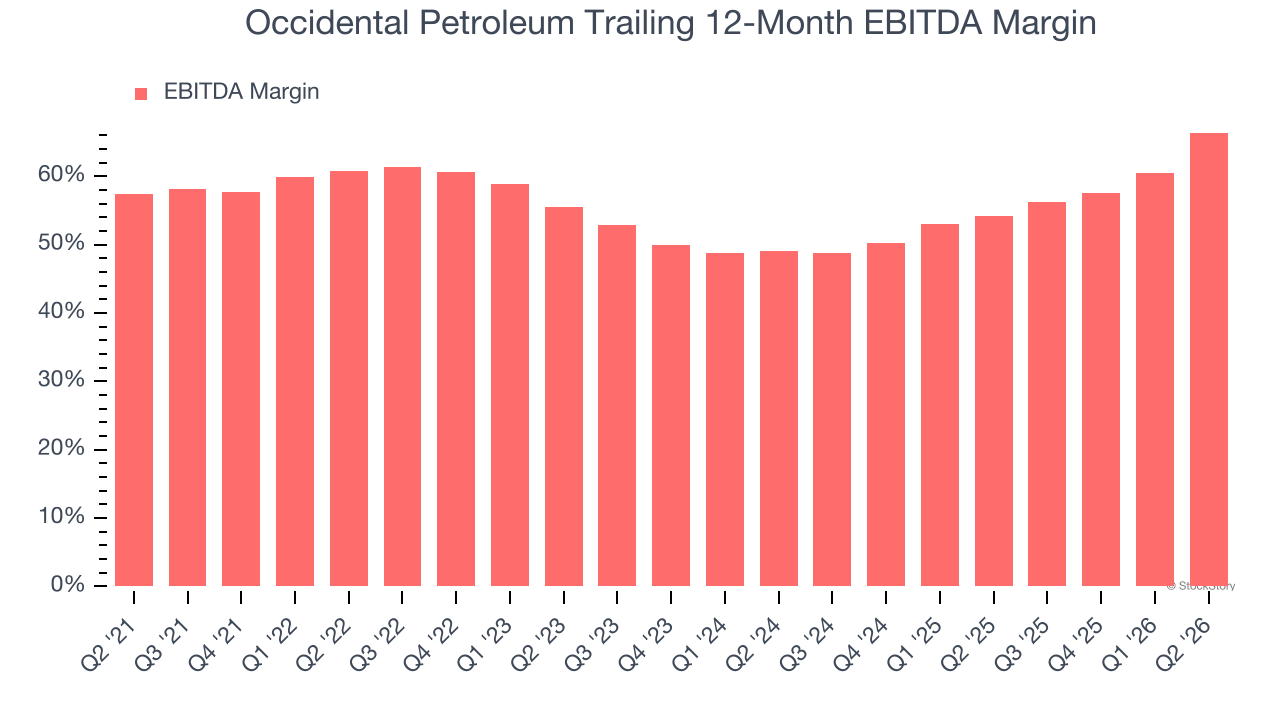
This quarter, Occidental Petroleum generated an EBITDA margin profit margin of 74.8%, up 19.6 percentage points year on year. This increase was a welcome development and shows it was more efficient. This adjusted EBITDA beat Wall Street’s estimates by 28.2%.
Cash Is King
Adjusted EBITDA shows how profitable a company’s existing “rock” is before financing and reinvestment, while free cash flow shows how much value remains after paying to replace those wells. Because production declines over time, strong EBITDA can coexist with weak FCF if drilling is expensive or declines are steep. FCF therefore captures both operating efficiency and the cost of sustaining production.
Occidental Petroleum has shown terrific cash profitability, driven by its lucrative business model that enables it to reinvest, return capital to investors, and stay ahead of the competition. The company’s free cash flow margin was among the best in the energy upstream and integrated energy sector, averaging 25.5% over the last five years.
The level of free cash flow is important, but its durability across cycles is just as critical. Consistent margins are far more valuable than volatile swings driven by commodity prices.
Occidental Petroleum’s ratio of quarterly free cash flow volatility to WTI crude price volatility over the past five years was 4.7 (lower is better), indicating excellent insulation from commodity swings. This stability supports capital access in downturns and positions Occidental Petroleum to act as a consolidator when weaker peers are forced to retrench.
You may be asking why we wait until the free cash flow line to perform this stability analysis versus commodity prices. Why not compare revenue or EBITDA to WTI Crude prices in the case of Occidental Petroleum? Because what ultimately matters is not how much revenue or profit you earn when prices are high but how much cash you can generate when prices are low. Free cash flow is the superior metric because it includes everything from hedging prowess to growth and maintenance capex to management behavior during good times and bad.
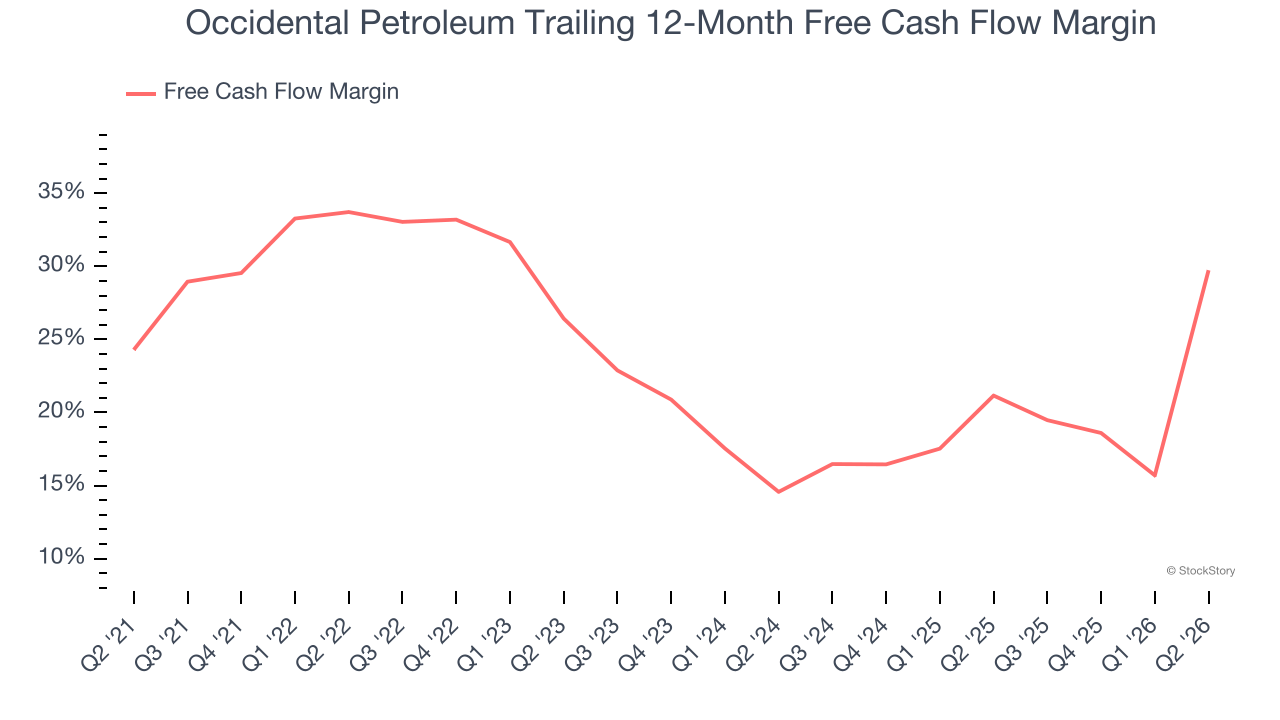
Occidental Petroleum’s free cash flow clocked in at $5.09 billion in Q2, equivalent to a 63.1% margin. This result was good as its margin was 39.4 percentage points higher than in the same quarter last year. Its cash profitability was also above its five-year level, and we hope the company can build on this trend.
Key Takeaways from Occidental Petroleum’s Q2 Results
It was good to see Occidental Petroleum beat analysts’ EPS expectations this quarter. We were also excited its revenue outperformed Wall Street’s estimates by a wide margin. Zooming out, we think this was a good print with some key areas of upside. The stock traded up 1.5% to $54.82 immediately following the results.
Occidental Petroleum may have had a good quarter, but does that mean you should invest right now? We think that the latest quarter is only one piece of the longer-term business quality puzzle. Quality, when combined with valuation, can help determine if the stock is a buy. We cover that in our actionable full research report which you can read here (it’s free).