

Global tire manufacturer Goodyear (NASDAQ:GT) reported Q2 CY2026 results beating Wall Street’s revenue expectations, but sales fell by 4.8% year on year to $4.25 billion. Its non-GAAP loss of $0.61 per share was 2.8% above analysts’ consensus estimates.
Is now the time to buy Goodyear? Find out by accessing our full research report, it’s free.
Goodyear (GT) Q2 CY2026 Highlights:
- Revenue: $4.25 billion vs analyst estimates of $4.21 billion (4.8% year-on-year decline, 0.9% beat)
- Adjusted EPS: -$0.61 vs analyst estimates of -$0.63 (2.8% beat)
- Operating Margin: 0.8%, in line with the same quarter last year
- Free Cash Flow was $893 million, up from -$387 million in the same quarter last year
- Market Capitalization: $2.06 billion
Company Overview
With its iconic blimp floating above major sporting events since 1925, Goodyear (NASDAQ:GT) is one of the world's largest tire manufacturers, producing and selling tires for automobiles, trucks, aircraft, and other vehicles, along with related services.
Revenue Growth
A company’s long-term performance is an indicator of its overall quality. Even a bad business can shine for one or two quarters, but a top-tier one grows for years. Unfortunately, Goodyear’s 3.9% annualized revenue growth over the last five years was sluggish. This was below our standard for the industrials sector and is a poor baseline for our analysis.
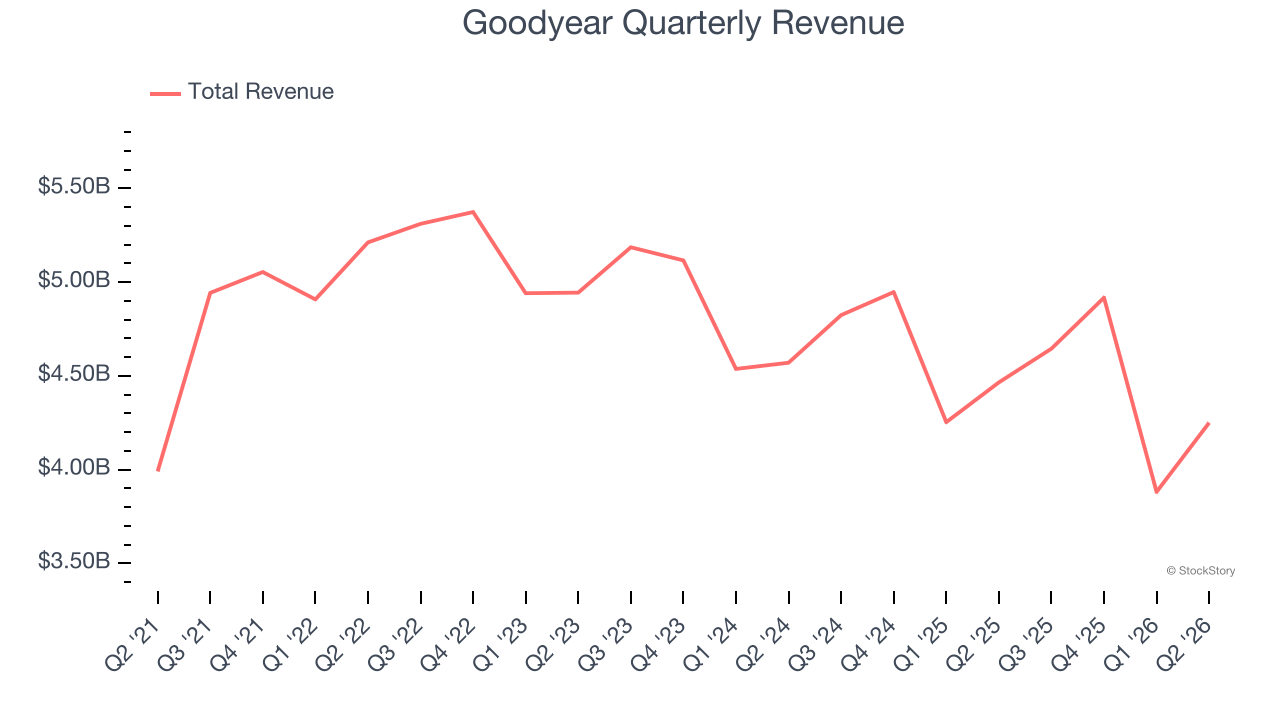
Long-term growth is the most important, but within industrials, a half-decade historical view may miss new industry trends or demand cycles. Goodyear’s performance shows it grew in the past but relinquished its gains over the last two years, as its revenue fell by 4.5% annually. 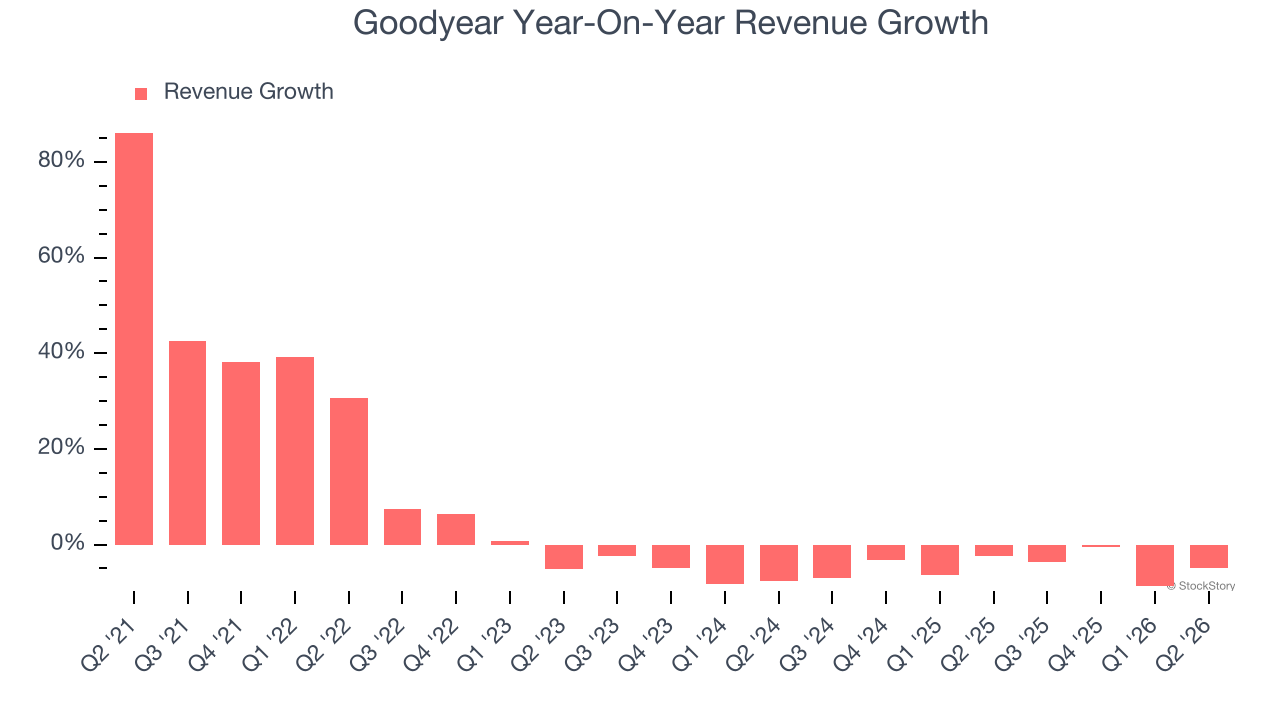
This quarter, Goodyear’s revenue fell by 4.8% year on year to $4.25 billion but beat Wall Street’s estimates by 0.9%.
Looking ahead, sell-side analysts expect revenue to grow 1.8% over the next 12 months. While this projection indicates its newer products and services will spur better top-line performance, it is still below the sector average.
ONE MORE THING: 3 Hidden Platforms Growing 3X Faster than Amazon, Google, and PayPal. Amazon, Google, and Meta all followed the same playbook: Dominate an ignored market. Build an unbeatable moat. Scale until you’re unstoppable.
These three platforms are running that exact playbook right now. The early investors in Amazon made fortunes. The early investors in these could do the same. Get All 3 Stocks Here for FREE.
Operating Margin
Operating margin is a key measure of profitability. Think of it as net income - the bottom line - excluding the impact of taxes and interest on debt, which are less connected to business fundamentals.
Goodyear was profitable over the last five years but held back by its large cost base. Its average operating margin of 3.1% was weak for an industrials business. This result isn’t too surprising given its low gross margin as a starting point.
Looking at the trend in its profitability, Goodyear’s operating margin decreased by 3.5 percentage points over the last five years. This raises questions about the company’s expense base because its revenue growth should have given it leverage on its fixed costs, resulting in better economies of scale and profitability. Goodyear’s performance was poor no matter how you look at it - it shows that costs were rising and it couldn’t pass them onto its customers.
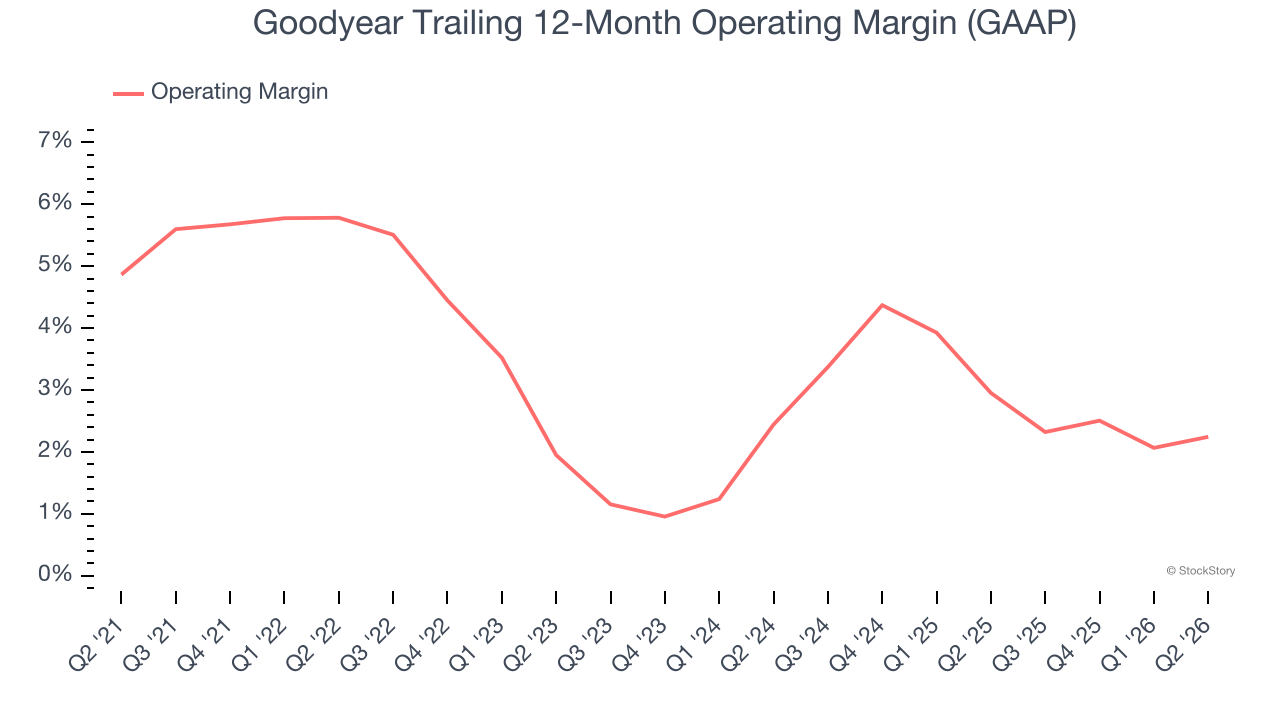
This quarter, Goodyear’s breakeven margin was 0.8%, in line with the same quarter last year. This indicates the company’s cost structure has recently been stable.
Earnings Per Share
Revenue trends explain a company’s historical growth, but the long-term change in earnings per share (EPS) points to the profitability of that growth — for example, a company could inflate its sales through excessive spending on advertising and promotions.
Sadly for Goodyear, its EPS declined by 17.7% annually over the last five years while its revenue grew by 3.9%. This tells us the company became less profitable on a per-share basis as it expanded.
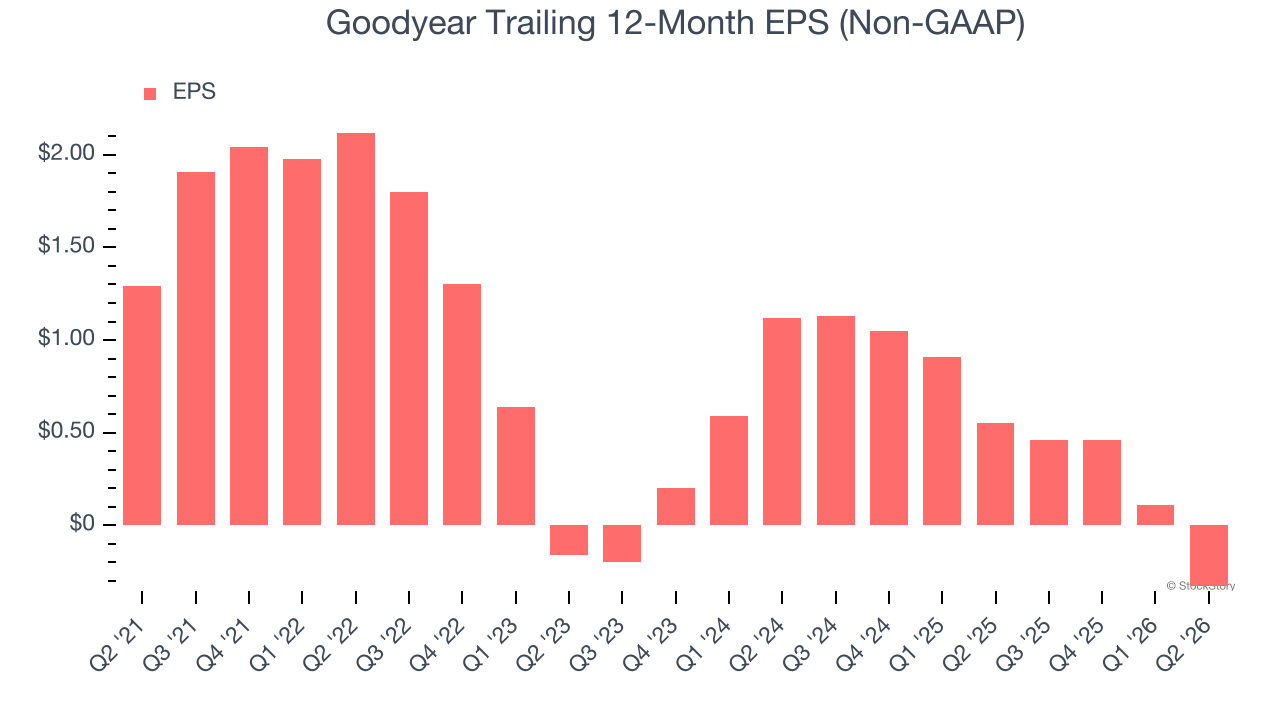
We can take a deeper look into Goodyear’s earnings to better understand the drivers of its performance. As we mentioned earlier, Goodyear’s operating margin was flat this quarter but declined by 3.5 percentage points over the last five years. Its share count also grew by 17%, meaning the company not only became less efficient with its operating expenses but also diluted its shareholders. 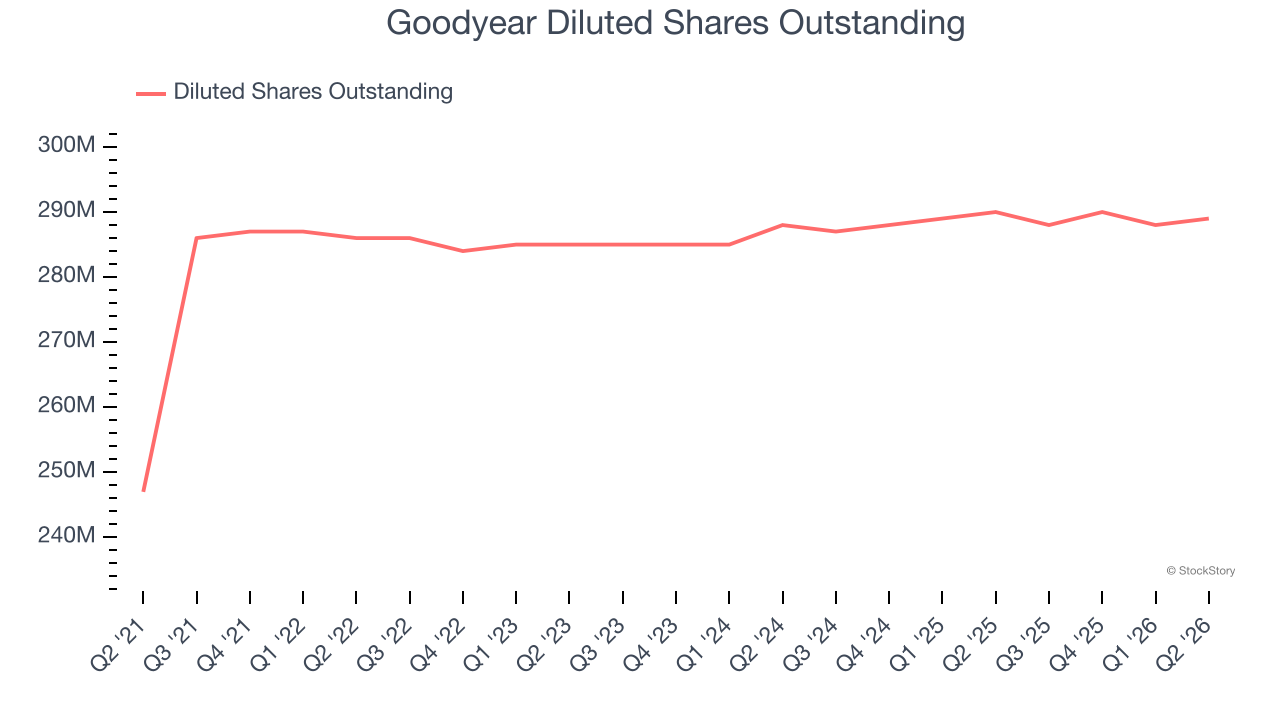
Like with revenue, we analyze EPS over a shorter period to see if we are missing a change in the business.
For Goodyear, its two-year annual EPS declines of 51.5% show it’s continued to underperform. These results were bad no matter how you slice the data.
In Q2, Goodyear reported adjusted EPS of negative $0.61, down from negative $0.17 in the same quarter last year. Despite falling year on year, this print beat analysts’ estimates by 2.8%. Over the next 12 months, Wall Street is optimistic. Analysts forecast Goodyear’s full-year EPS will flip from negative $0.33 to positive $0.18.
Key Takeaways from Goodyear’s Q2 Results
It was good to see Goodyear narrowly top analysts’ revenue expectations this quarter. We were also glad its EPS outperformed Wall Street’s estimates. Overall, this print had some key positives. The stock remained flat at $6.99 immediately after reporting.
So do we think Goodyear is an attractive buy at the current price? What happened in the latest quarter matters, but not as much as longer-term business quality and valuation, when deciding whether to invest in this stock. We cover that in our actionable full research report which you can read here (it’s free).