

Industrial component provider Timken (NYSE:TKR) reported Q1 CY2026 results beating Wall Street’s revenue expectations, with sales up 8% year on year to $1.23 billion. Its non-GAAP profit of $1.67 per share was 11.2% above analysts’ consensus estimates.
Is now the time to buy Timken? Find out by accessing our full research report, it’s free.
Timken (TKR) Q1 CY2026 Highlights:
- Revenue: $1.23 billion vs analyst estimates of $1.17 billion (8% year-on-year growth, 5% beat)
- Adjusted EPS: $1.67 vs analyst estimates of $1.50 (11.2% beat)
- Adjusted EBITDA: $231 million vs analyst estimates of $214.6 million (18.8% margin, 7.6% beat)
- Management raised its full-year Adjusted EPS guidance to $6 at the midpoint, a 4.3% increase
- Operating Margin: 13.7%, up from 12.6% in the same quarter last year
- Free Cash Flow Margin: 0%, down from 2.1% in the same quarter last year
- Organic Revenue rose 4.3% year on year (miss)
- Market Capitalization: $7.65 billion
"We delivered a strong start to 2026, achieving double-digit earnings growth and margin expansion versus last year," said Lucian Boldea, president and chief executive officer.
Company Overview
Established after the founder noticed the difficulty freight wagons had making sharp turns, Timken (NYSE:TKR) is a provider of industrial parts used across various sectors.
Revenue Growth
Examining a company’s long-term performance can provide clues about its quality. Any business can have short-term success, but a top-tier one grows for years. Over the last five years, Timken grew its sales at a tepid 5.3% compounded annual growth rate. This was below our standard for the industrials sector and is a tough starting point for our analysis.
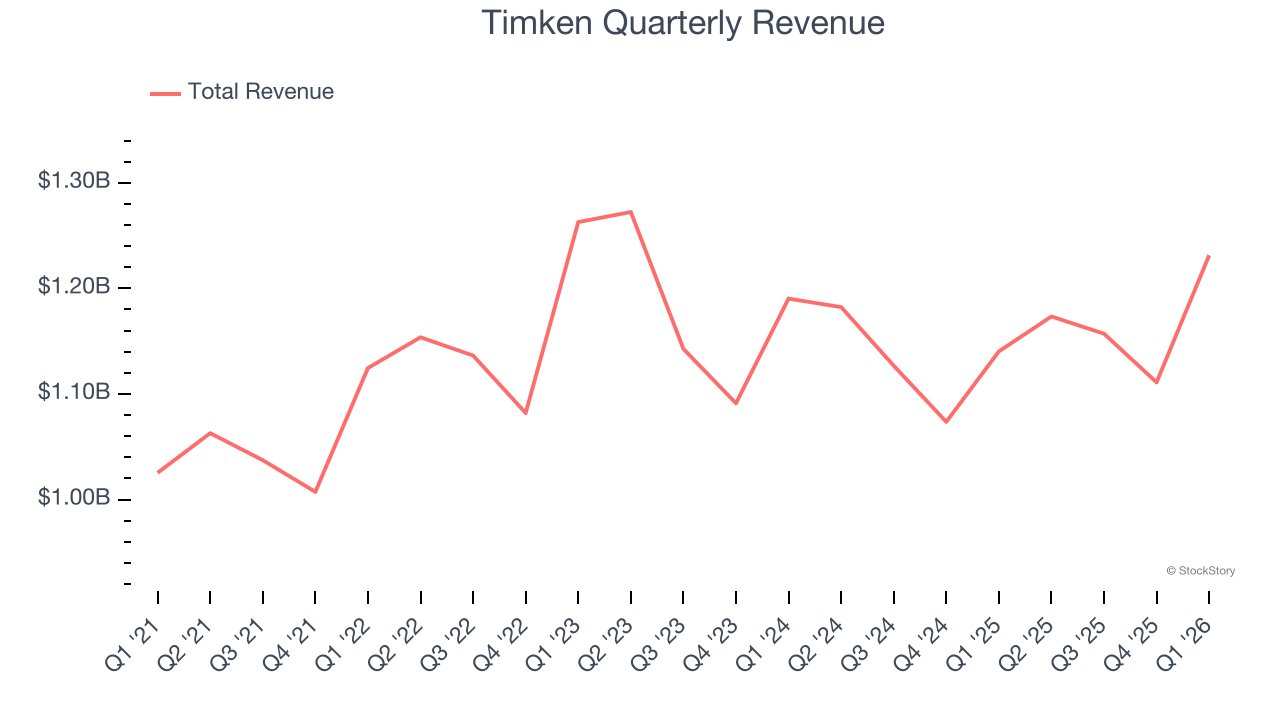
We at StockStory place the most emphasis on long-term growth, but within industrials, a half-decade historical view may miss cycles, industry trends, or a company capitalizing on catalysts such as a new contract win or a successful product line. Timken’s recent performance shows its demand has slowed as its revenue was flat over the last two years. 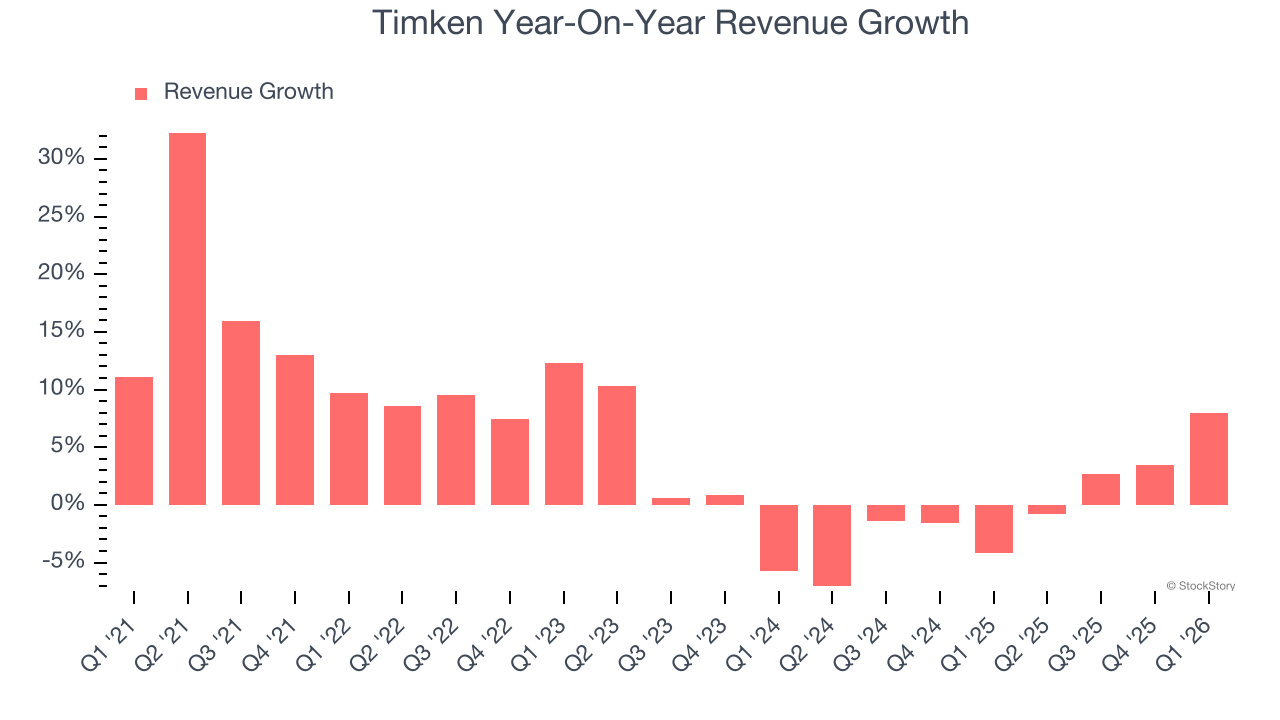
Timken also reports organic revenue, which strips out one-time events like acquisitions and currency fluctuations that don’t accurately reflect its fundamentals. Over the last two years, Timken’s organic revenue averaged 1.6% year-on-year declines. Because this number aligns with its two-year revenue growth, we can see the company’s core operations (not acquisitions and divestitures) drove most of its results. 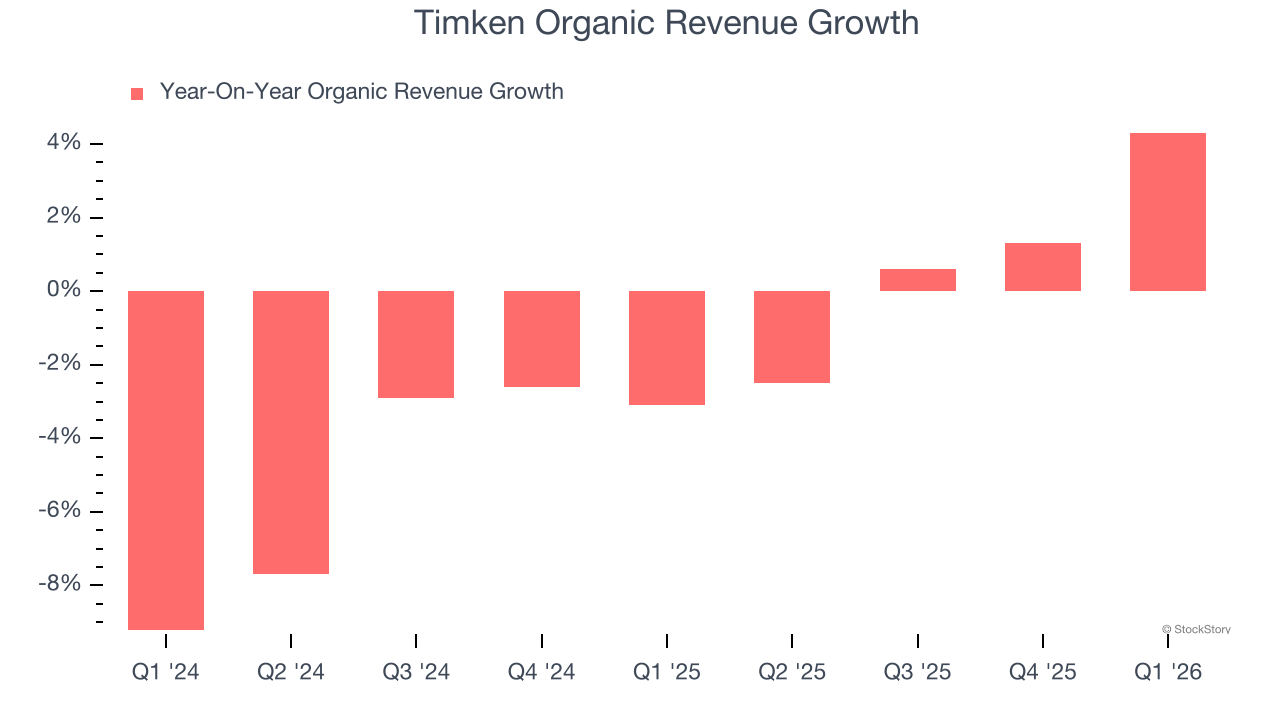
This quarter, Timken reported year-on-year revenue growth of 8%, and its $1.23 billion of revenue exceeded Wall Street’s estimates by 5%.
Looking ahead, sell-side analysts expect revenue to grow 2.8% over the next 12 months. While this projection suggests its newer products and services will catalyze better top-line performance, it is still below average for the sector.
ALSO WORTH WATCHING: Nvidia’s Quiet Partner. Nvidia’s chips cost a hundred grand. The connectors that make them work cost even more. One company makes them all.
Every AI server needs specialized infrastructure the chip companies don’t make. High-speed cables. Power connectors. Thermal sensors. This 90-year-old company built a monopoly on it. The AI boom just started. This stock is still flying under the radar. Claim The Stock Ticker Here for FREE.
Operating Margin
Timken’s operating margin has more or less stayed the same over the last 12 months , averaging 12.9% over the last five years. This profitability was top-notch for an industrials business, showing it’s an well-run company with an efficient cost structure.
Looking at the trend in its profitability, Timken’s operating margin might fluctuated slightly but has generally stayed the same over the last five years. This raises questions about the company’s expense base because its revenue growth should have given it leverage on its fixed costs, resulting in better economies of scale and profitability.
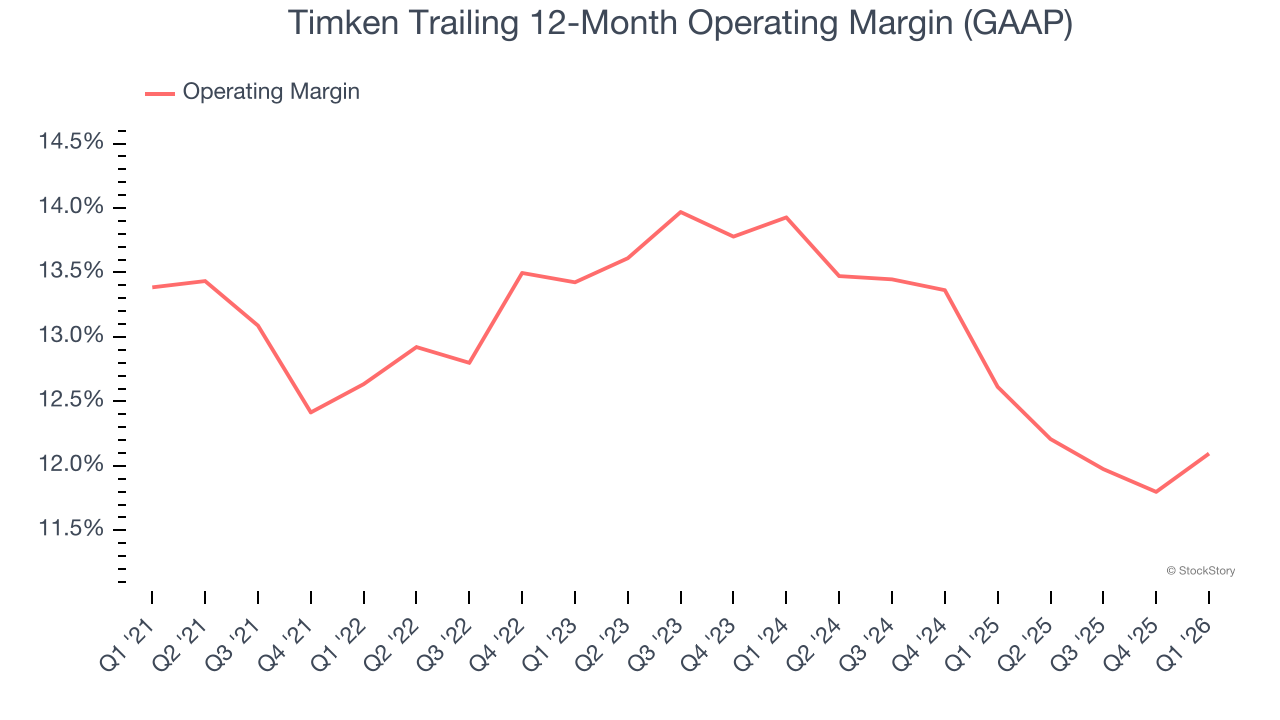
In Q1, Timken generated an operating margin profit margin of 13.7%, up 1.1 percentage points year on year. The increase was encouraging, and because its operating margin rose more than its gross margin, we can infer it was more efficient with expenses such as marketing, R&D, and administrative overhead.
Earnings Per Share
We track the long-term change in earnings per share (EPS) for the same reason as long-term revenue growth. Compared to revenue, however, EPS highlights whether a company’s growth is profitable.
Timken’s unimpressive 5.1% annual EPS growth over the last five years aligns with its revenue performance. This tells us it maintained its per-share profitability as it expanded.
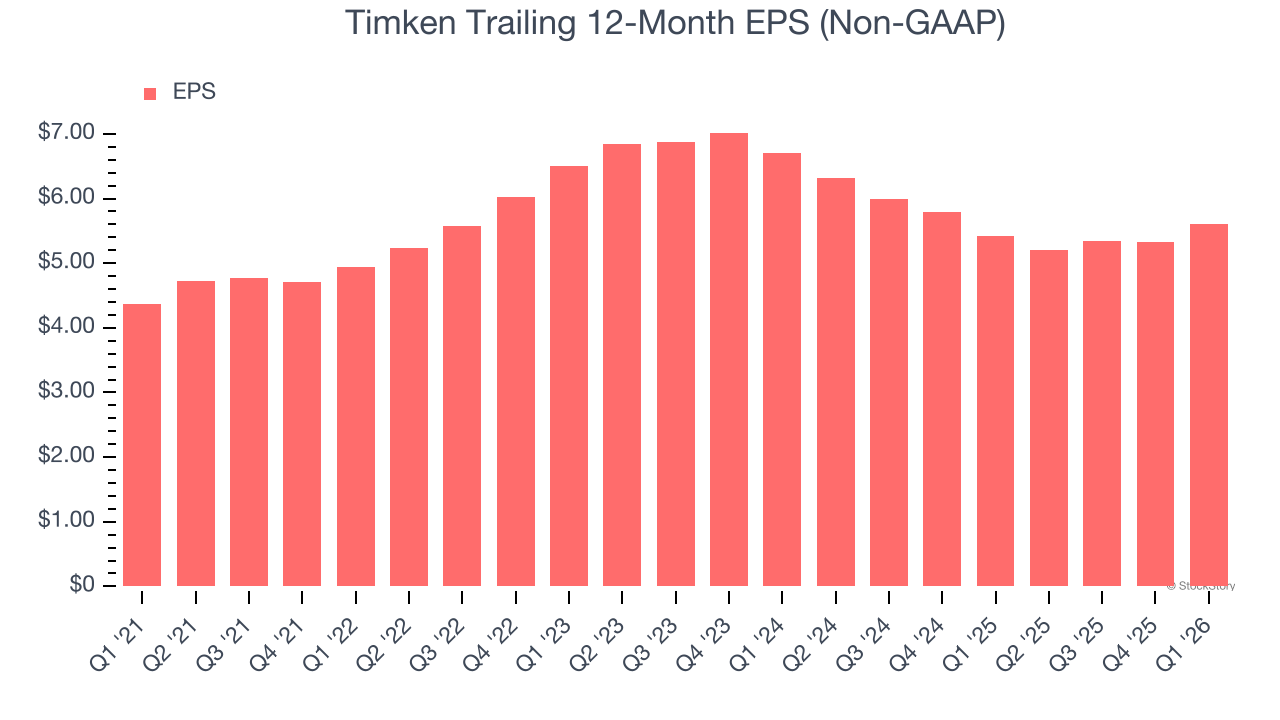
Like with revenue, we analyze EPS over a shorter period to see if we are missing a change in the business.
Timken’s two-year annual EPS declines of 8.6% were bad and lower than its flat revenue.
We can take a deeper look into Timken’s earnings to better understand the drivers of its performance. While we mentioned earlier that Timken’s operating margin expanded this quarter, a two-year view shows its margin has declined. This was the most relevant factor (aside from the revenue impact) behind its lower earnings; interest expenses and taxes can also affect EPS but don’t tell us as much about a company’s fundamentals.
In Q1, Timken reported adjusted EPS of $1.67, up from $1.40 in the same quarter last year. This print easily cleared analysts’ estimates, and shareholders should be content with the results. We also like to analyze expected EPS growth based on Wall Street analysts’ consensus projections, but there is insufficient data.
Key Takeaways from Timken’s Q1 Results
We were impressed by how significantly Timken blew past analysts’ EBITDA expectations this quarter. We were also excited its adjusted operating income outperformed Wall Street’s estimates by a wide margin. On the other hand, its organic revenue missed. Overall, we think this was a decent quarter with some key metrics above expectations. The stock remained flat at $110.62 immediately after reporting.
Sure, Timken had a solid quarter, but if we look at the bigger picture, is this stock a buy? The latest quarter does matter, but not nearly as much as longer-term fundamentals and valuation, when deciding if the stock is a buy. We cover that in our actionable full research report which you can read here (it’s free).