

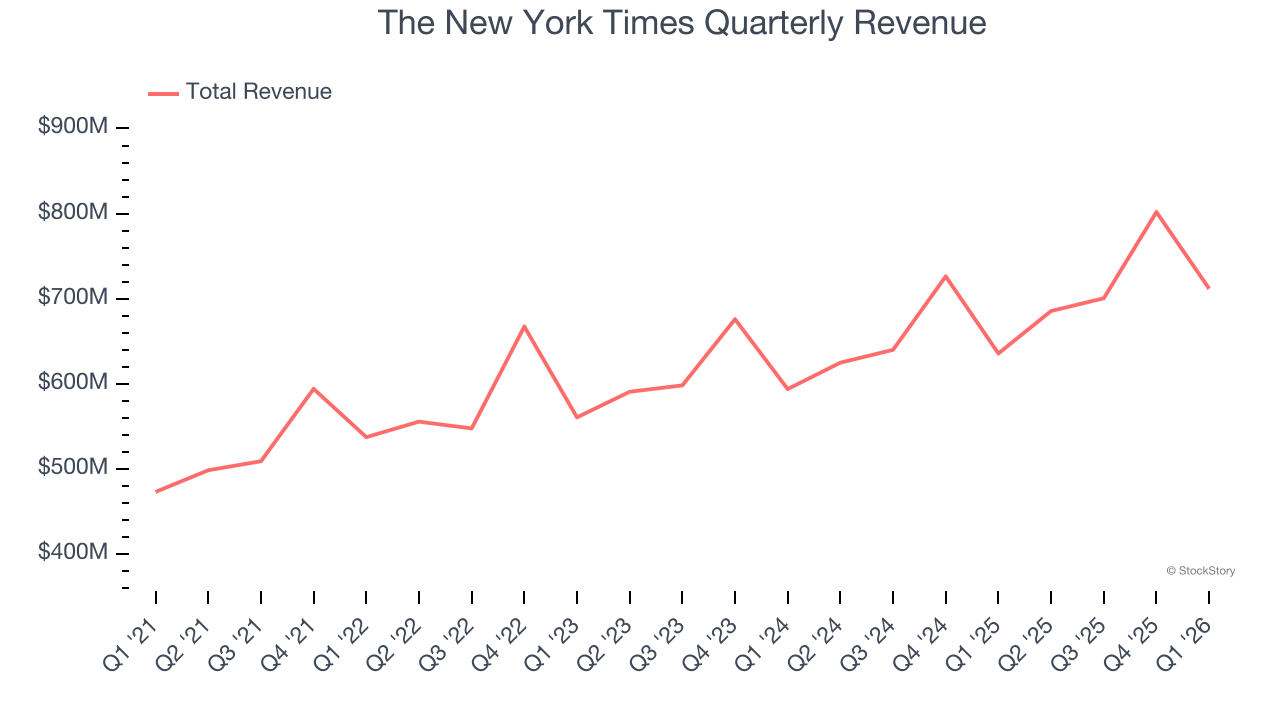
Newspaper and digital media company The New York Times (NYSE:NYT) reported Q1 CY2026 results beating Wall Street’s revenue expectations, with sales up 12% year on year to $712.2 million. Its non-GAAP profit of $0.61 per share was 30.2% above analysts’ consensus estimates.
Is now the time to buy The New York Times? Find out by accessing our full research report, it’s free.
The New York Times (NYT) Q1 CY2026 Highlights:
- Revenue: $712.2 million vs analyst estimates of $700 million (12% year-on-year growth, 1.7% beat)
- Adjusted EPS: $0.61 vs analyst estimates of $0.47 (30.2% beat)
- Adjusted EBITDA: $111.2 million vs analyst estimates of $109.8 million (15.6% margin, 1.3% beat)
- Operating Margin: 12.7%, up from 9.2% in the same quarter last year
- Free Cash Flow Margin: 11.4%, down from 14.1% in the same quarter last year
- Subscribers: up 1.46 million year on year
- Market Capitalization: $12.51 billion
Company Overview
Founded in 1851, The New York Times (NYSE:NYT) is an American media organization known for its influential newspaper and expansive digital journalism platforms.
Revenue Growth
A company’s long-term sales performance is one signal of its overall quality. Any business can put up a good quarter or two, but the best consistently grow over the long haul. Regrettably, The New York Times’s sales grew at a weak 9.9% compounded annual growth rate over the last five years. This was below our standard for the consumer discretionary sector and is a poor baseline for our analysis.
Long-term growth is the most important, but within consumer discretionary, product cycles are short and revenue can be hit-driven due to rapidly changing trends and consumer preferences. The New York Times’s recent performance shows its demand has slowed as its annualized revenue growth of 8.6% over the last two years was below its five-year trend. We’re wary when companies in the sector see decelerations in revenue growth, as it could signal changing consumer tastes aided by low switching costs. 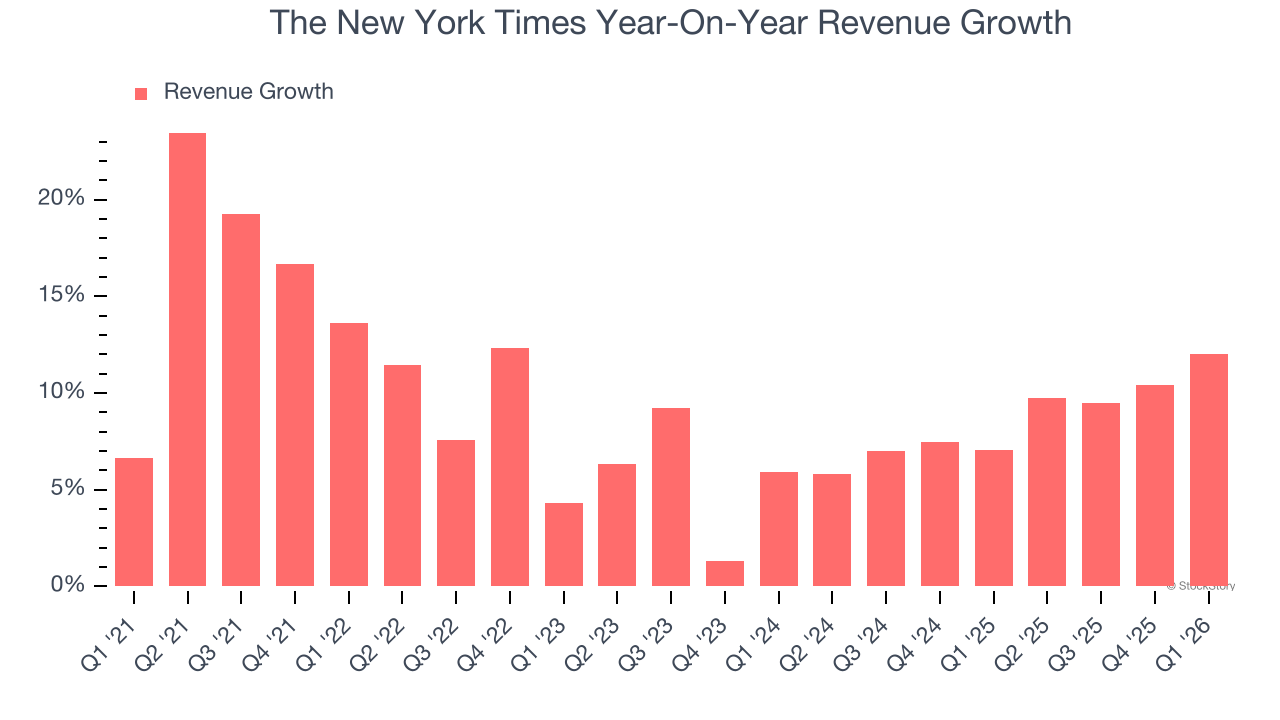
The New York Times also discloses its number of subscribers, which reached 12.52 million in the latest quarter. Over the last two years, The New York Times’s subscribers averaged 12% year-on-year growth. Because this number is higher than its revenue growth during the same period, we can see the company’s monetization has fallen. 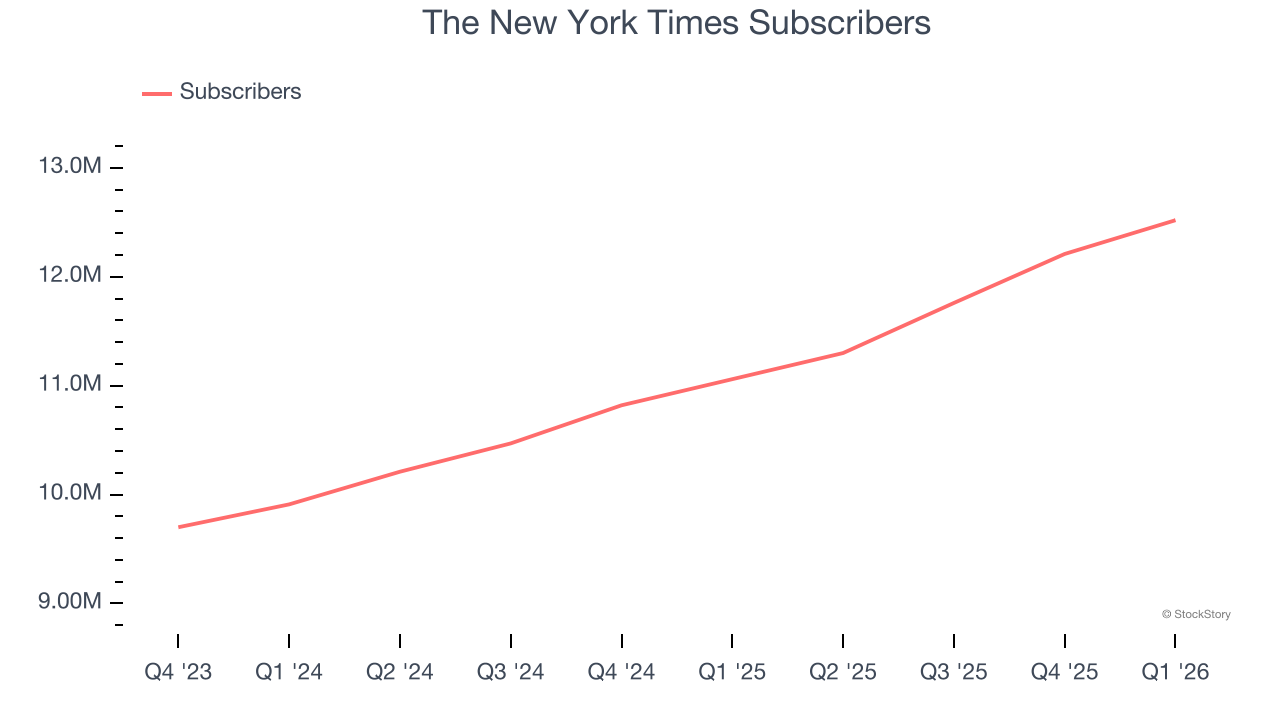
This quarter, The New York Times reported year-on-year revenue growth of 12%, and its $712.2 million of revenue exceeded Wall Street’s estimates by 1.7%.
Looking ahead, sell-side analysts expect revenue to grow 7.3% over the next 12 months, similar to its two-year rate. This projection doesn't excite us and indicates its products and services will face some demand challenges.
ALSO WORTH WATCHING: Nvidia’s Quiet Partner. Nvidia’s chips cost a hundred grand. The connectors that make them work cost even more. One company makes them all.
Every AI server needs specialized infrastructure the chip companies don’t make. High-speed cables. Power connectors. Thermal sensors. This 90-year-old company built a monopoly on it. The AI boom just started. This stock is still flying under the radar. Claim The Stock Ticker Here for FREE.
Operating Margin
Operating margin is an important measure of profitability as it shows the portion of revenue left after accounting for all core expenses – everything from the cost of goods sold to advertising and wages. It’s also useful for comparing profitability across companies with different levels of debt and tax rates because it excludes interest and taxes.
The New York Times’s operating margin has risen over the last 12 months and averaged 14.9% over the last two years. The company’s higher efficiency is a breath of fresh air, but its suboptimal cost structure means it still sports inadequate profitability for a consumer discretionary business.
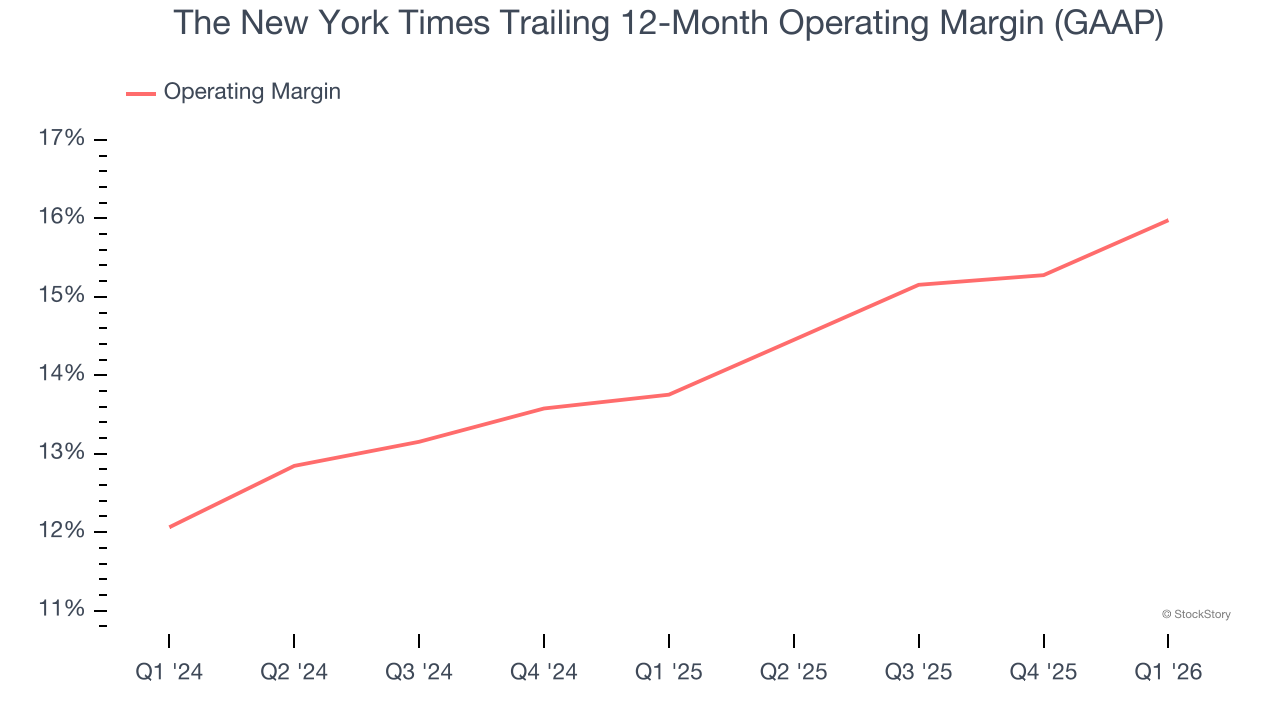
This quarter, The New York Times generated an operating margin profit margin of 12.7%, up 3.5 percentage points year on year. This increase was a welcome development and shows it was more efficient.
Earnings Per Share
We track the long-term change in earnings per share (EPS) for the same reason as long-term revenue growth. Compared to revenue, however, EPS highlights whether a company’s growth is profitable.
The New York Times’s EPS grew at 20.3% compounded annual growth rate over the last five years. On the bright side, this performance was better than its 9.9% annualized revenue growth and tells us the company became more profitable on a per-share basis as it expanded.
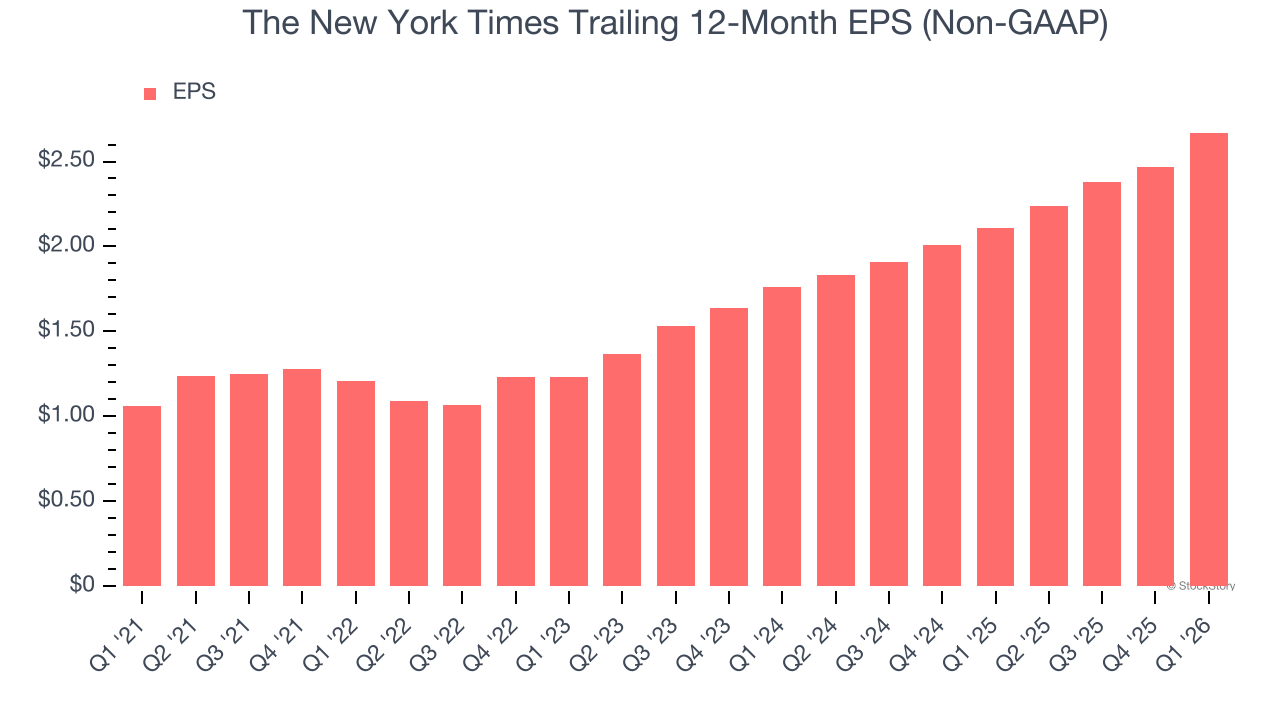
In Q1, The New York Times reported adjusted EPS of $0.61, up from $0.41 in the same quarter last year. This print easily cleared analysts’ estimates, and shareholders should be content with the results. We also like to analyze expected EPS growth based on Wall Street analysts’ consensus projections, but there is insufficient data.
Key Takeaways from The New York Times’s Q1 Results
It was good to see The New York Times beat analysts’ EPS expectations this quarter. We were also happy its revenue outperformed Wall Street’s estimates. Overall, we think this was a solid quarter with some key areas of upside. The stock traded up 4.8% to $80.94 immediately following the results.
Sure, The New York Times had a solid quarter, but if we look at the bigger picture, is this stock a buy? The latest quarter does matter, but not nearly as much as longer-term fundamentals and valuation, when deciding if the stock is a buy. We cover that in our actionable full research report which you can read here (it’s free).