

Oil and gas producer Magnolia Oil & Gas (NYSE:MGY) reported Q1 CY2026 results beating Wall Street’s revenue expectations, with sales up 2.3% year on year to $358.5 million. Its GAAP profit of $0.54 per share was 5.3% above analysts’ consensus estimates.
Is now the time to buy Magnolia Oil & Gas? Find out by accessing our full research report, it’s free.
Magnolia Oil & Gas (MGY) Q1 CY2026 Highlights:
- Revenue: $358.5 million vs analyst estimates of $351.7 million (2.3% year-on-year growth, 1.9% beat)
- EPS (GAAP): $0.54 vs analyst estimates of $0.51 (5.3% beat)
- Adjusted EBITDA: $253.3 million vs analyst estimates of $248 million (70.7% margin, 2.1% beat)
- Operating Margin: 35.6%, down from 38.8% in the same quarter last year
- Free Cash Flow Margin: 55.1%, up from 26.6% in the same quarter last year
- Market Capitalization: $5.73 billion
“Magnolia’s first quarter financial and operating metrics delivered a strong start to 2026,” said Chairman, President and CEO Chris Stavros.
Company Overview
Operating over 600,000 net acres primarily in two distinct South Texas regions, Magnolia Oil & Gas (NYSE:MGY) drills and produces oil, natural gas, and natural gas liquids from South Texas formations.
Revenue Growth
A company’s long-term performance can give signals about its business quality. Even a bad business, especially in a cyclical industry, can shine for a year or so, but a top-tier one should exhibit resilience through cycles. Luckily, Magnolia Oil & Gas’s sales grew at an impressive 18.7% compounded annual growth rate over the last five years. Its growth beat the average energy upstream and integrated energy company and shows its offerings resonate with customers, a helpful starting point for our analysis.
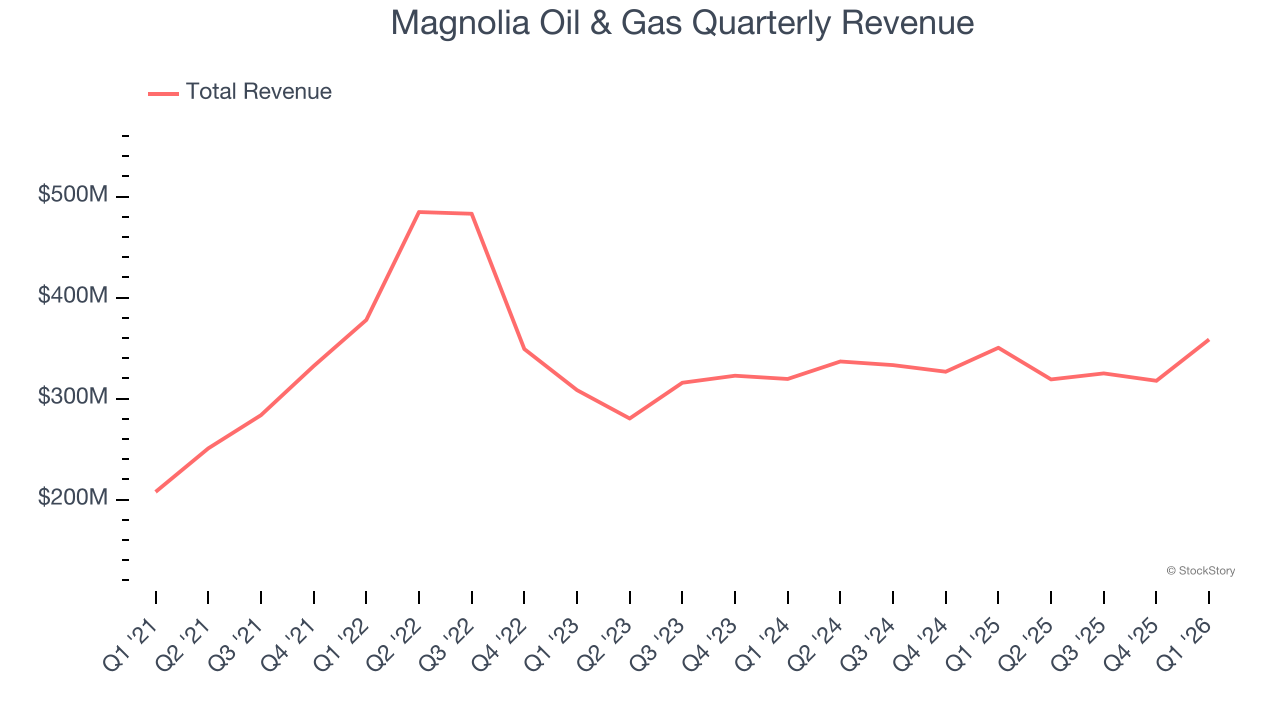
Even a long stretch in Energy can be shaped by a single commodity cycle, so extending the view to ten years adds another perspective and reveals which companies are built to grow regardless of the pricing regime. Magnolia Oil & Gas’s annualized revenue growth of 0.3% over the last eight years is below its five-year trend, but we still think the results were respectable.
This quarter, Magnolia Oil & Gas reported modest year-on-year revenue growth of 2.3% but beat Wall Street’s estimates by 1.9%.
ONE MORE THING: The $21 AI Application Stock Wall Street Forgot. While Wall Street obsesses over who’s building AI, one company is already using it to print money. And nobody’s paying attention.
AI chip stocks trade at ridiculous valuations. This company processes a trillion consumer signals monthly using AI and trades at a third of the price. The gap won’t last. The institutions will figure it out. You need to see this first. Read the FREE Report Before They Notice.
Adjusted EBITDA Margin
Magnolia Oil & Gas has been a well-oiled machine over the last five years. It demonstrated elite profitability for an upstream and integrated energy business, boasting an average EBITDA margin of 72%.
Looking at the trend in its profitability, Magnolia Oil & Gas’s EBITDA margin decreased by 7.9 percentage points over the last year. Even though its historical margin was healthy, shareholders will want to see Magnolia Oil & Gas become more profitable in the future.
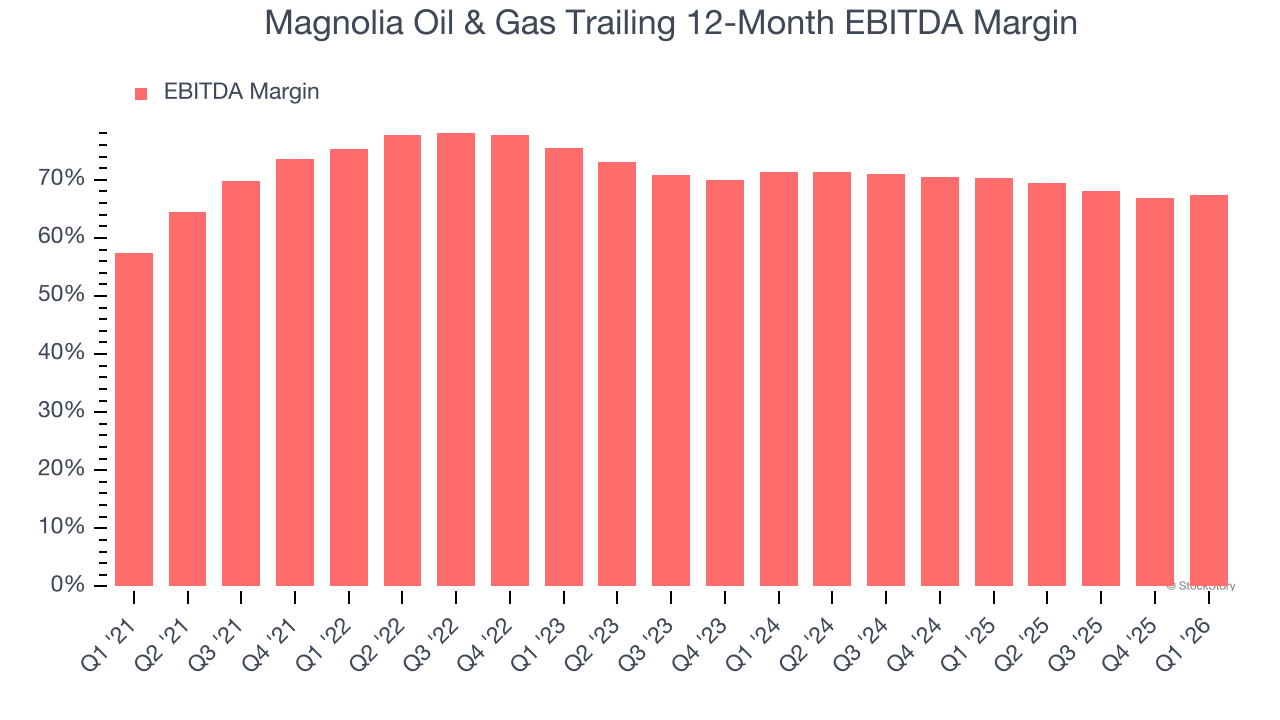
In Q1, Magnolia Oil & Gas generated an EBITDA margin profit margin of 70.7%, up 1.7 percentage points year on year. This increase was a welcome development and shows it was more efficient. This adjusted EBITDA beat Wall Street’s estimates by 2.1%.
Cash Is King
Adjusted EBITDA shows how profitable a company’s existing “rock” is before financing and reinvestment, while free cash flow shows how much value remains after paying to replace those wells. Because production declines over time, strong EBITDA can coexist with weak FCF if drilling is expensive or declines are steep. FCF therefore captures both operating efficiency and the cost of sustaining production.
Magnolia Oil & Gas has shown terrific cash profitability, driven by its lucrative business model that enables it to reinvest, return capital to investors, and stay ahead of the competition. The company’s free cash flow margin was among the best in the energy upstream and integrated energy sector, averaging an eye-popping 41% over the last five years.
Absolute FCF margin levels matter but so does stability of free cash flow. All else equal, we’d prefer a 25.0% average free cash flow margin that is quite steady no matter how commodity prices behave rather than extremely high margins when times are good and negative ones when they’re tough.
Magnolia Oil & Gas’s ratio of quarterly free cash flow volatility to WTI crude price volatility over the past five years was 2.8 (lower is better), indicating excellent insulation from commodity swings. This stability supports superior capital access in downturns and positions Magnolia Oil & Gas to act as a consolidator when weaker peers are forced to retrench.
You may be asking why we wait until the free cash flow line to perform this stability analysis versus commodity prices. Why not compare revenue or EBITDA to WTI in the case of Magnolia Oil & Gas? Because what ultimately matters is not how much revenue or profit you earn when prices are high but how much cash you can generate when prices are low. Free cash flow is the superior metric because it includes everything from hedging prowess to growth and maintenance capex to management behavior during good times and bad.
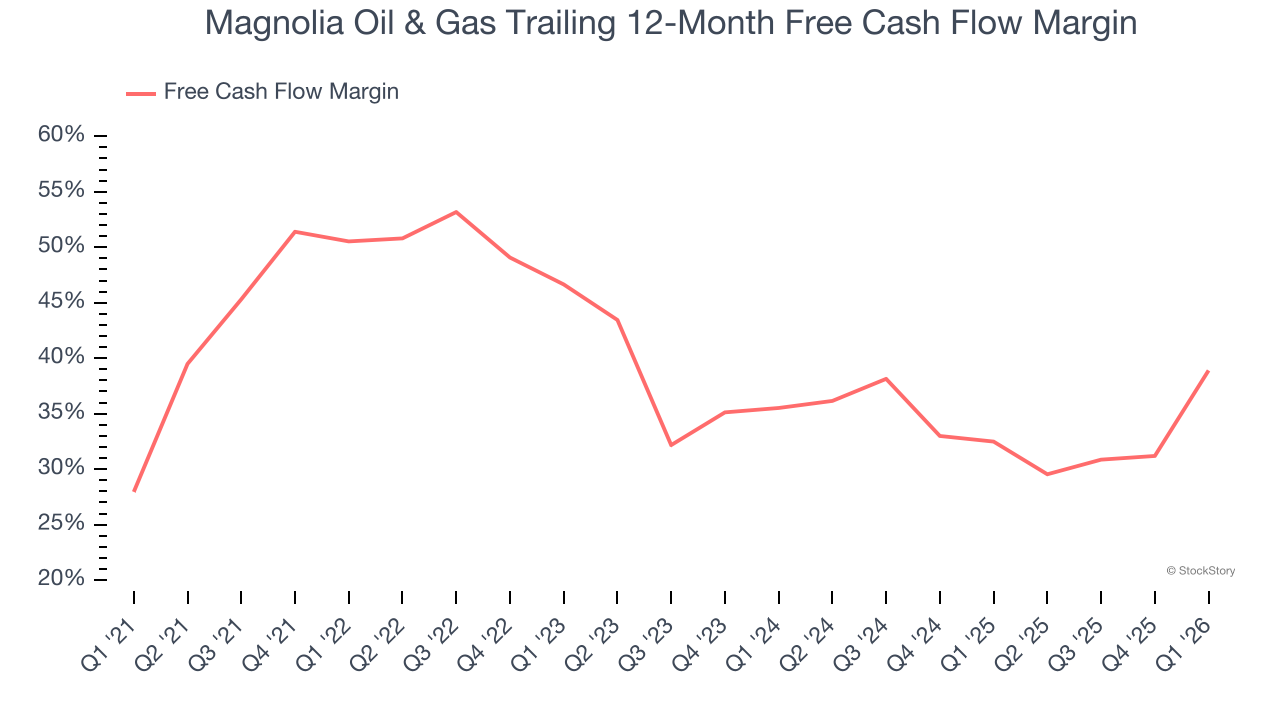
Magnolia Oil & Gas’s free cash flow clocked in at $197.6 million in Q1, equivalent to a 55.1% margin. This result was good as its margin was 28.5 percentage points higher than in the same quarter last year. Its cash profitability was also above its five-year level, and we hope the company can build on this trend.
Key Takeaways from Magnolia Oil & Gas’s Q1 Results
It was encouraging to see Magnolia Oil & Gas beat analysts’ revenue expectations this quarter. We were also glad its EPS outperformed Wall Street’s estimates. Overall, this print had some key positives. The market seemed to be hoping for more, and the stock traded down 2.8% to $27.87 immediately following the results.
So should you invest in Magnolia Oil & Gas right now? If you’re making that decision, you should consider the bigger picture of valuation, business qualities, as well as the latest earnings. We cover that in our actionable full research report which you can read here (it’s free).