

Workplace furnishings manufacturer HNI Corporation (NYSE:HNI) missed Wall Street’s revenue expectations in Q1 CY2026, but sales rose 125% year on year to $1.35 billion. Its non-GAAP profit of $0.34 per share was 18.3% above analysts’ consensus estimates.
Is now the time to buy HNI? Find out by accessing our full research report, it’s free.
HNI (HNI) Q1 CY2026 Highlights:
- Revenue: $1.35 billion vs analyst estimates of $1.37 billion (125% year-on-year growth, 2% miss)
- Adjusted EPS: $0.34 vs analyst estimates of $0.29 (18.3% beat)
- Operating Margin: -2.7%, down from 5.1% in the same quarter last year
- Free Cash Flow was -$207.5 million compared to -$3.7 million in the same quarter last year
- Market Capitalization: $2.61 billion
Company Overview
With roots dating back to 1944 and a significant acquisition of Kimball International in 2023, HNI (NYSE:HNI) manufactures and sells office furniture systems, seating, and storage solutions, as well as residential fireplaces and heating products.
Revenue Growth
Reviewing a company’s long-term sales performance reveals insights into its quality. Any business can put up a good quarter or two, but many enduring ones grow for years.
With $3.59 billion in revenue over the past 12 months, HNI is a mid-sized business services company, which sometimes brings disadvantages compared to larger competitors benefiting from better economies of scale. On the bright side, it can still flex high growth rates because it’s working from a smaller revenue base.
As you can see below, HNI’s 12.7% annualized revenue growth over the last five years was excellent. This shows it had high demand, a useful starting point for our analysis.
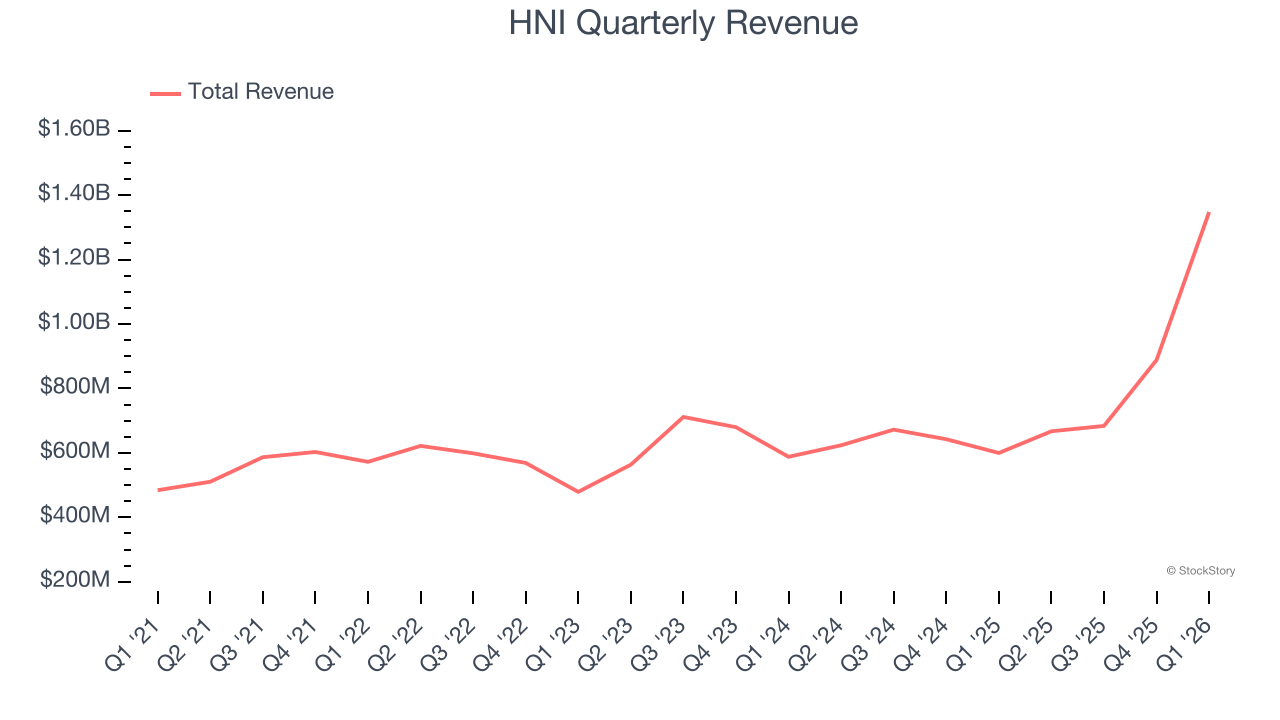
We at StockStory place the most emphasis on long-term growth, but within business services, a half-decade historical view may miss recent innovations or disruptive industry trends. HNI’s annualized revenue growth of 18.8% over the last two years is above its five-year trend, suggesting its demand was strong and recently accelerated. 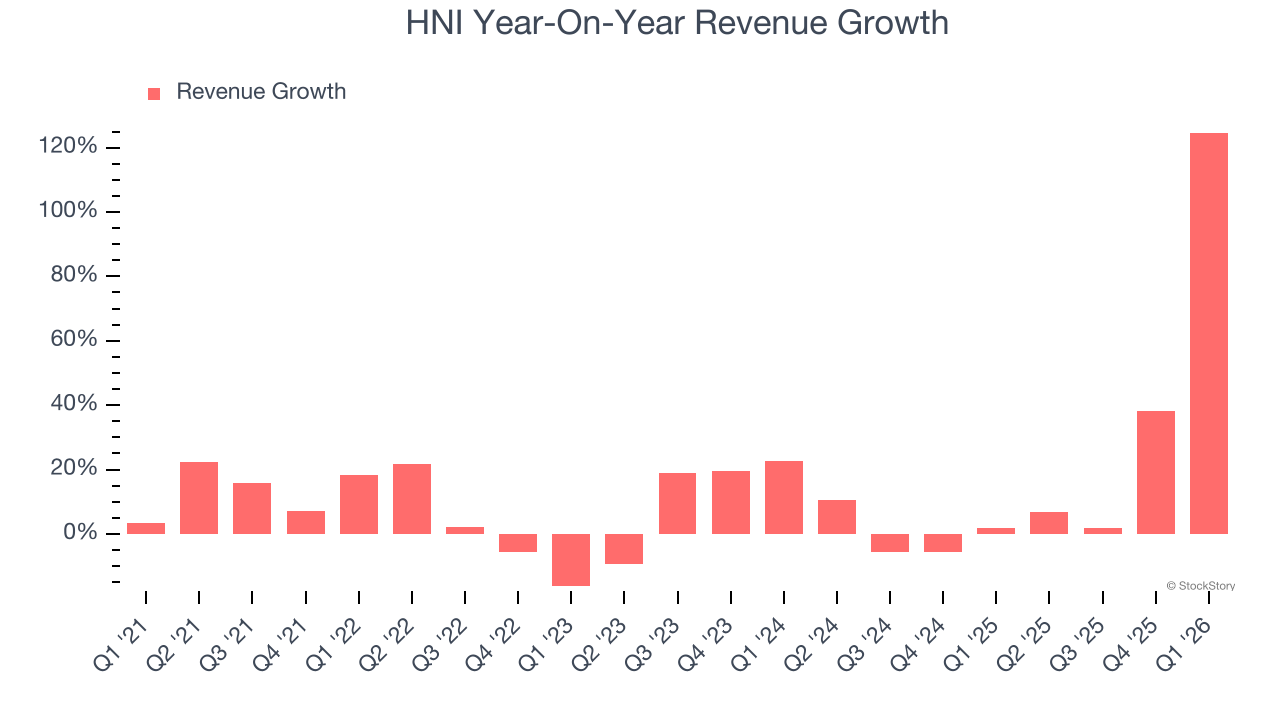
This quarter, HNI achieved a magnificent 125% year-on-year revenue growth rate, but its $1.35 billion of revenue fell short of Wall Street’s lofty estimates.
Looking ahead, sell-side analysts expect revenue to grow 111% over the next 12 months, an improvement versus the last two years. This projection is eye-popping and implies its newer products and services will catalyze better top-line performance.
ONE MORE THING: The $21 AI Application Stock Wall Street Forgot. While Wall Street obsesses over who’s building AI, one company is already using it to print money. And nobody’s paying attention.
AI chip stocks trade at ridiculous valuations. This company processes a trillion consumer signals monthly using AI and trades at a third of the price. The gap won’t last. The institutions will figure it out. You need to see this first. Read the FREE Report Before They Notice.
Adjusted Operating Margin
Adjusted operating margin is an important measure of profitability as it shows the portion of revenue left after accounting for all core expenses – everything from the cost of goods sold to advertising and wages. It’s also useful for comparing profitability across companies because it excludes non-recurring expenses, interest on debt, and taxes.
HNI’s adjusted operating margin has generally stayed the same over the last 12 months, averaging 7% over the last five years. This profitability was paltry for a business services business and caused by its suboptimal cost structure.
Looking at the trend in its profitability, HNI’s adjusted operating margin might fluctuated slightly but has generally stayed the same over the last five years. This raises questions about the company’s expense base because its revenue growth should have given it leverage on its fixed costs, resulting in better economies of scale and profitability.
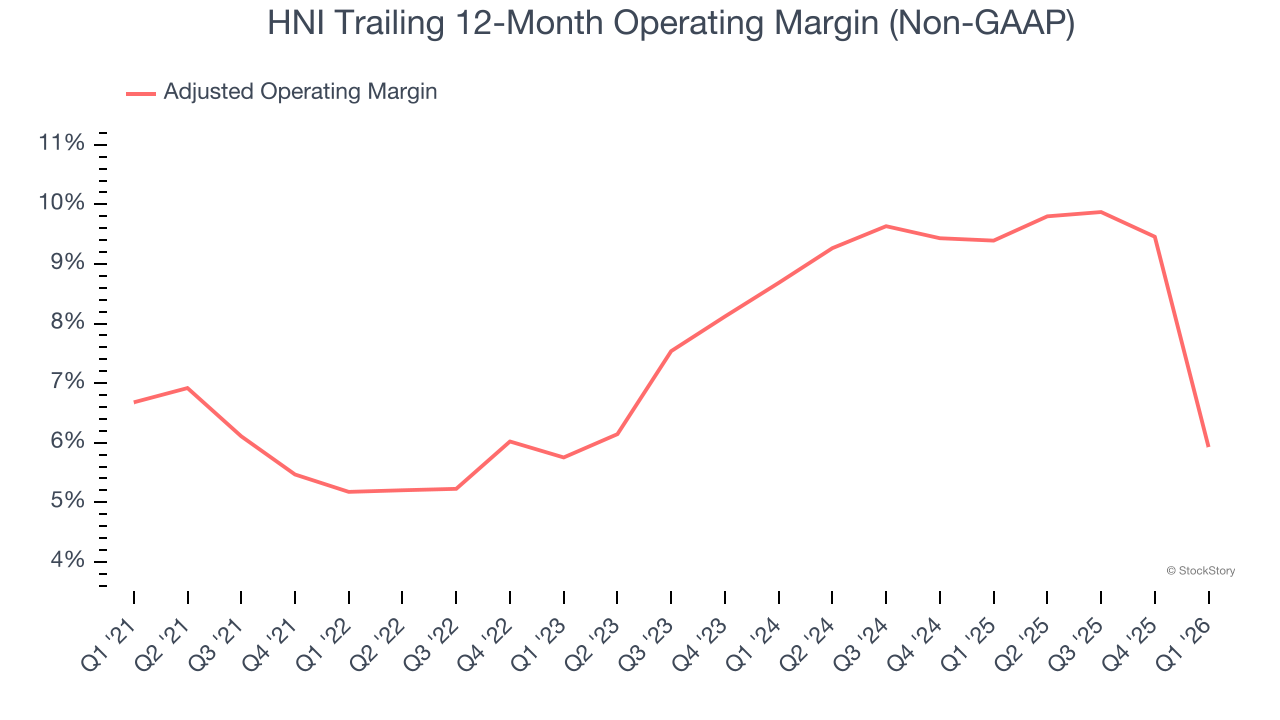
This quarter, HNI generated an adjusted operating margin profit margin of negative 1.4%, down 7.6 percentage points year on year. This contraction shows it was less efficient because its expenses grew faster than its revenue.
Earnings Per Share
We track the long-term change in earnings per share (EPS) for the same reason as long-term revenue growth. Compared to revenue, however, EPS highlights whether a company’s growth is profitable.
HNI’s remarkable 11.9% annual EPS growth over the last five years aligns with its revenue performance. This tells us it maintained its per-share profitability as it expanded.
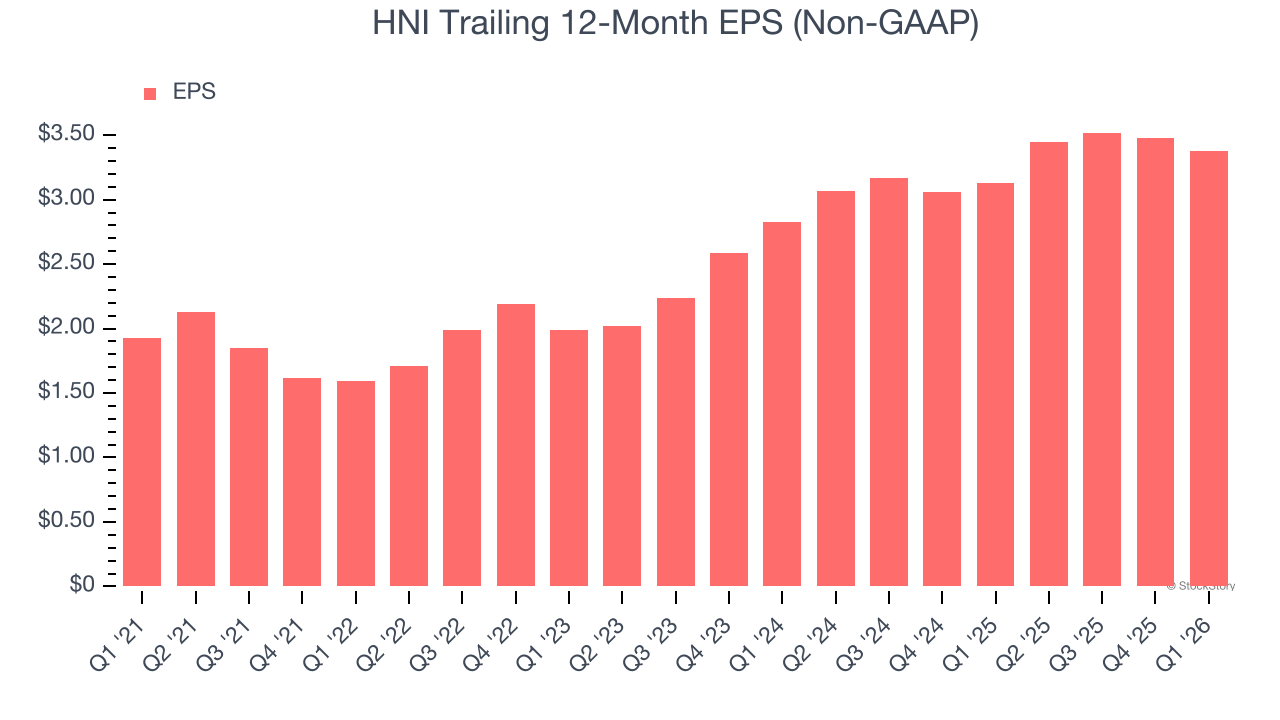
Like with revenue, we analyze EPS over a shorter period to see if we are missing a change in the business.
HNI’s two-year annual EPS growth of 9.3% was mediocre and lower than its 18.8% two-year revenue growth.
We can take a deeper look into HNI’s earnings to better understand the drivers of its performance. HNI’s adjusted operating margin has declined over the last two yearswhile its share count has grown 48.9%. This means the company not only became less efficient with its operating expenses but also diluted its shareholders. 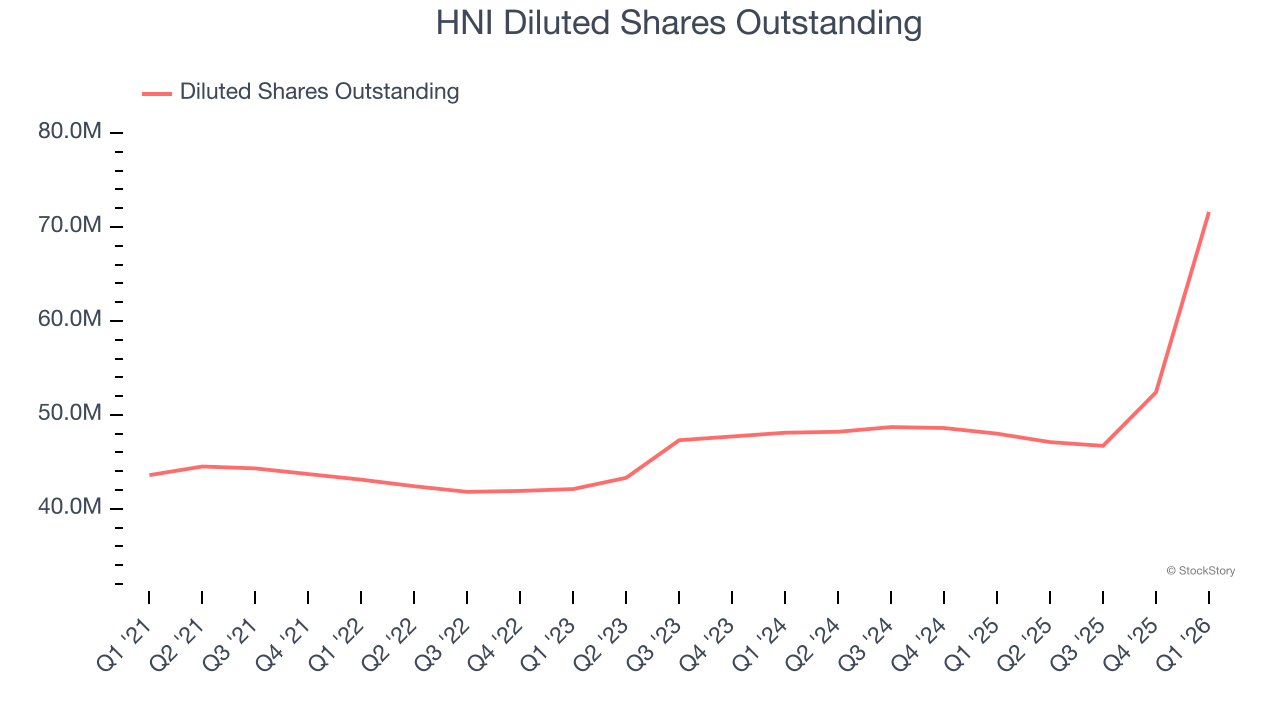
In Q1, HNI reported adjusted EPS of $0.34, down from $0.44 in the same quarter last year. Despite falling year on year, this print easily cleared analysts’ estimates. We also like to analyze expected EPS growth based on Wall Street analysts’ consensus projections, but there is insufficient data.
Key Takeaways from HNI’s Q1 Results
It was good to see HNI beat analysts’ EPS expectations this quarter. On the other hand, its revenue missed. Overall, this print was mixed. The stock remained flat at $36.20 immediately after reporting.
Should you buy the stock or not? We think that the latest quarter is only one piece of the longer-term business quality puzzle. Quality, when combined with valuation, can help determine if the stock is a buy. We cover that in our actionable full research report which you can read here (it’s free).