

Animal health company Elanco (NYSE:ELAN) announced better-than-expected revenue in Q1 CY2026, with sales up 14.9% year on year to $1.37 billion. The company expects next quarter’s revenue to be around $1.31 billion, close to analysts’ estimates. Its non-GAAP profit of $0.40 per share was 16.6% above analysts’ consensus estimates.
Is now the time to buy Elanco? Find out by accessing our full research report, it’s free.
Elanco (ELAN) Q1 CY2026 Highlights:
- Revenue: $1.37 billion vs analyst estimates of $1.28 billion (14.9% year-on-year growth, 6.8% beat)
- Adjusted EPS: $0.40 vs analyst estimates of $0.34 (16.6% beat)
- Adjusted EBITDA: $334 million vs analyst estimates of $300.1 million (24.4% margin, 11.3% beat)
- The company lifted its revenue guidance for the full year to $5.05 billion at the midpoint from $4.99 billion, a 1.3% increase
- Management raised its full-year Adjusted EPS guidance to $1.06 at the midpoint, a 2.9% increase
- EBITDA guidance for the full year is $990 million at the midpoint, above analyst estimates of $978 million
- Operating Margin: 22.4%, up from 9.4% in the same quarter last year
- Constant Currency Revenue rose 10% year on year (4% in the same quarter last year)
- Market Capitalization: $11.48 billion
"Elanco's strong first quarter results demonstrate the significant momentum of our innovation-led strategy," said Jeff Simmons, President and CEO of Elanco.
Company Overview
Originally established as a division of pharmaceutical giant Eli Lilly before becoming independent in 2018, Elanco Animal Health (NYSE:ELAN) develops and sells medications, vaccines, and other health products for pets and farm animals across more than 90 countries.
Revenue Growth
Reviewing a company’s long-term sales performance reveals insights into its quality. Any business can put up a good quarter or two, but the best consistently grow over the long haul. Unfortunately, Elanco’s 4.9% annualized revenue growth over the last five years was mediocre. This fell short of our benchmark for the healthcare sector and is a rough starting point for our analysis.
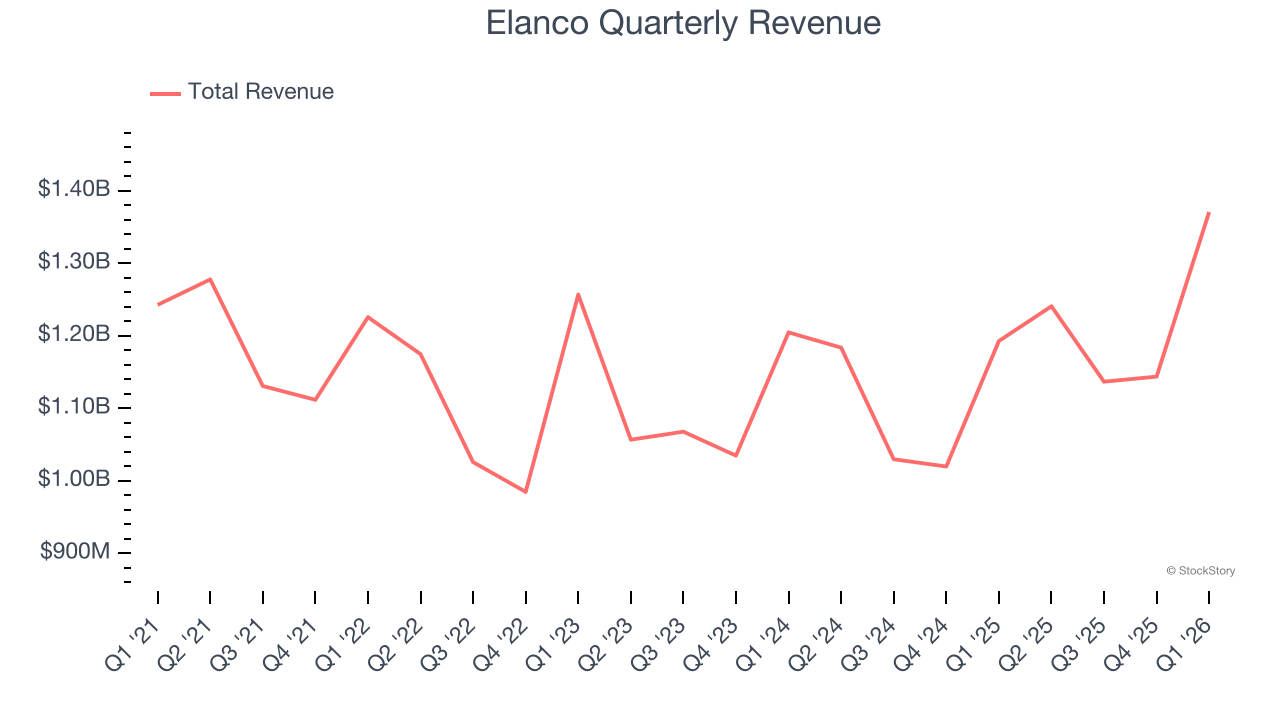
We at StockStory place the most emphasis on long-term growth, but within healthcare, a half-decade historical view may miss recent innovations or disruptive industry trends. Elanco’s annualized revenue growth of 5.9% over the last two years is above its five-year trend, which is encouraging. 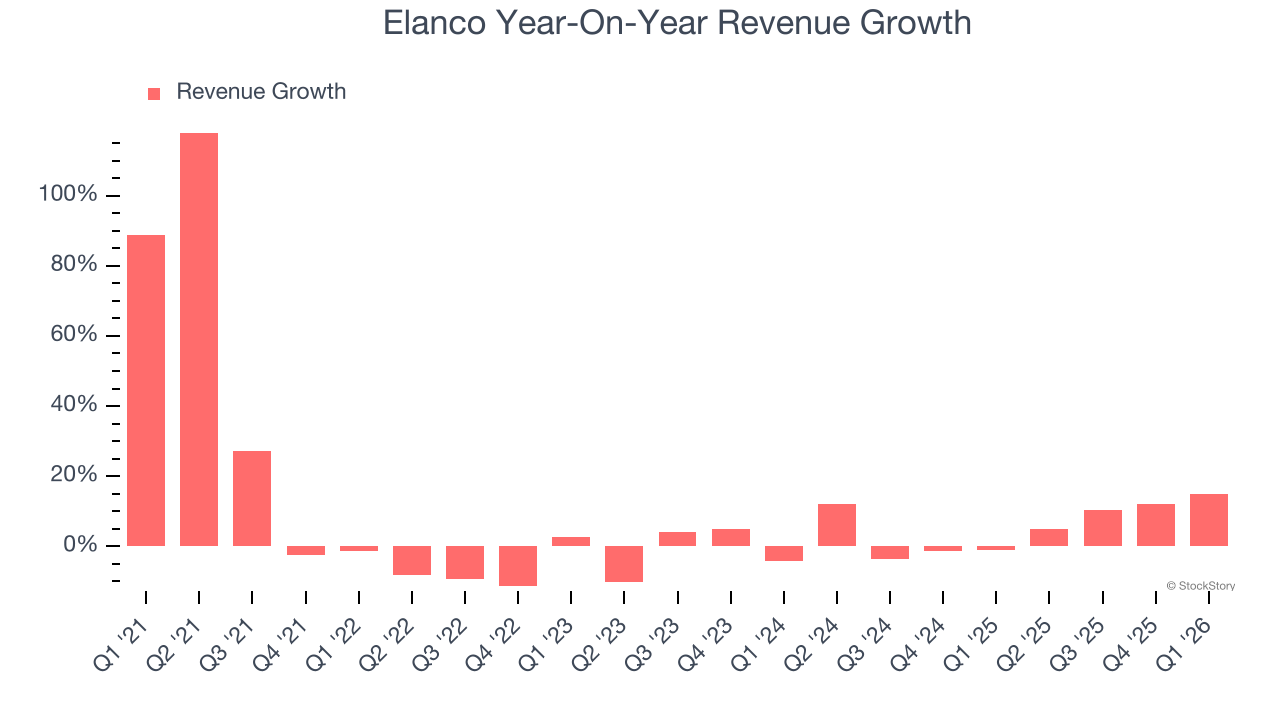
Elanco also reports sales performance excluding currency movements, which are outside the company’s control and not indicative of demand. Over the last two years, its constant currency sales averaged 7.3% year-on-year growth. Because this number aligns with its reported revenue growth, we can see that foreign exchange has not had a meaningful impact on topline. 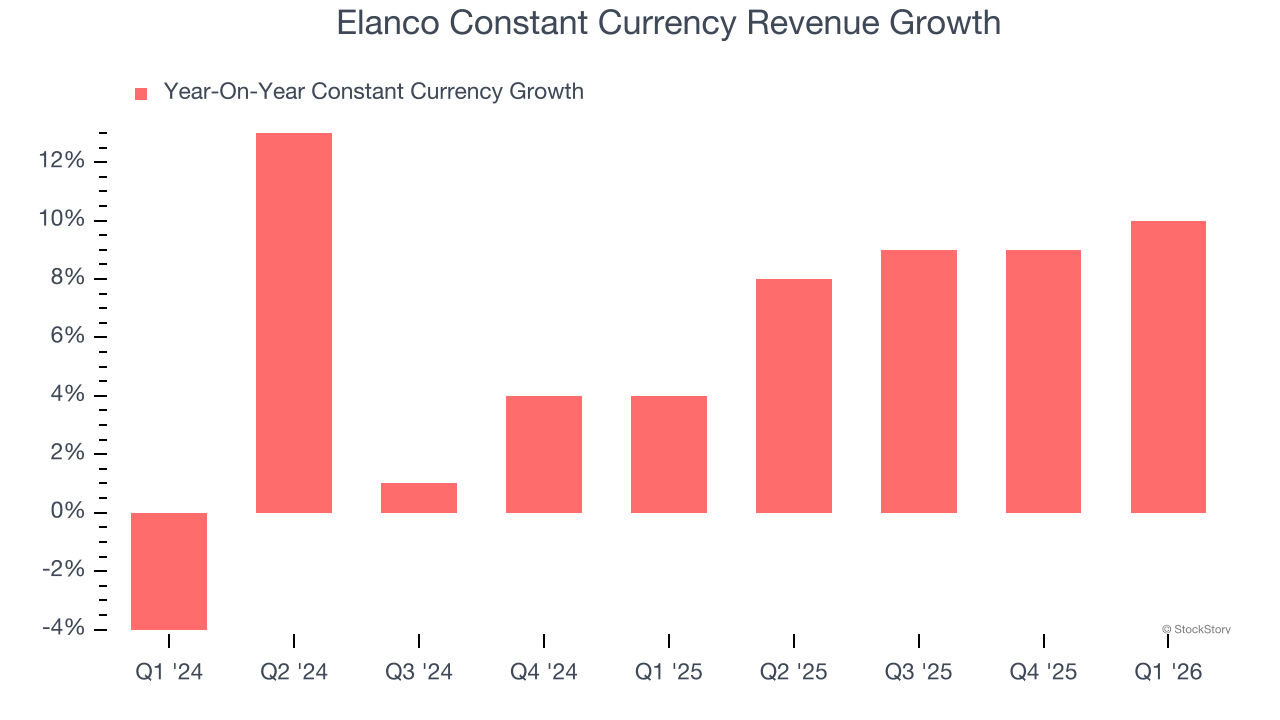
This quarter, Elanco reported year-on-year revenue growth of 14.9%, and its $1.37 billion of revenue exceeded Wall Street’s estimates by 6.8%. Company management is currently guiding for a 5.8% year-on-year increase in sales next quarter.
Looking further ahead, sell-side analysts expect revenue to grow 3.6% over the next 12 months, a slight deceleration versus the last two years. This projection is underwhelming and suggests its products and services will face some demand challenges.
WHILE YOU’RE HERE: The Next Palantir? One satellite company captures images of every point on Earth. Every single day. The Pentagon wants it. Hedge funds are using it to beat earnings. You’ve probably never heard of it.
This is what the early days of Palantir looked like before it became a $437 billion giant. Same playbook. Different technology. If you missed Palantir, you need to see this. Claim The Stock Ticker for Free HERE.
Adjusted Operating Margin
Adjusted operating margin is an important measure of profitability as it shows the portion of revenue left after accounting for all core expenses – everything from the cost of goods sold to advertising and wages. It’s also useful for comparing profitability across companies because it excludes non-recurring expenses, interest on debt, and taxes.
Elanco has managed its cost base well over the last five years. It demonstrated solid profitability for a healthcare business, producing an average adjusted operating margin of 18.7%.
Looking at the trend in its profitability, Elanco’s adjusted operating margin decreased by 2.7 percentage points over the last five years. This raises questions about the company’s expense base because its revenue growth should have given it leverage on its fixed costs, resulting in better economies of scale and profitability.
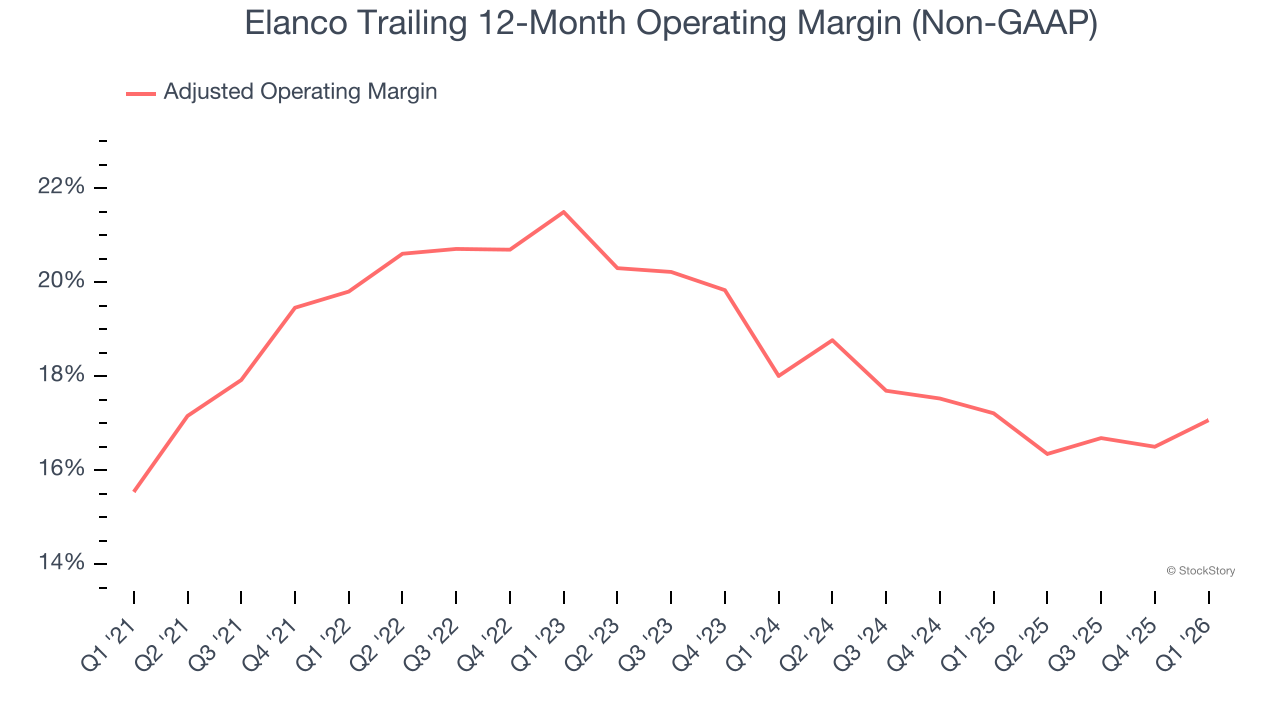
In Q1, Elanco generated an adjusted operating margin profit margin of 22.4%, up 1.4 percentage points year on year. This increase was a welcome development and shows it was more efficient.
Earnings Per Share
We track the long-term change in earnings per share (EPS) for the same reason as long-term revenue growth. Compared to revenue, however, EPS highlights whether a company’s growth is profitable.
Elanco’s decent 6.7% annual EPS growth over the last five years aligns with its revenue performance. This tells us it maintained its per-share profitability as it expanded.
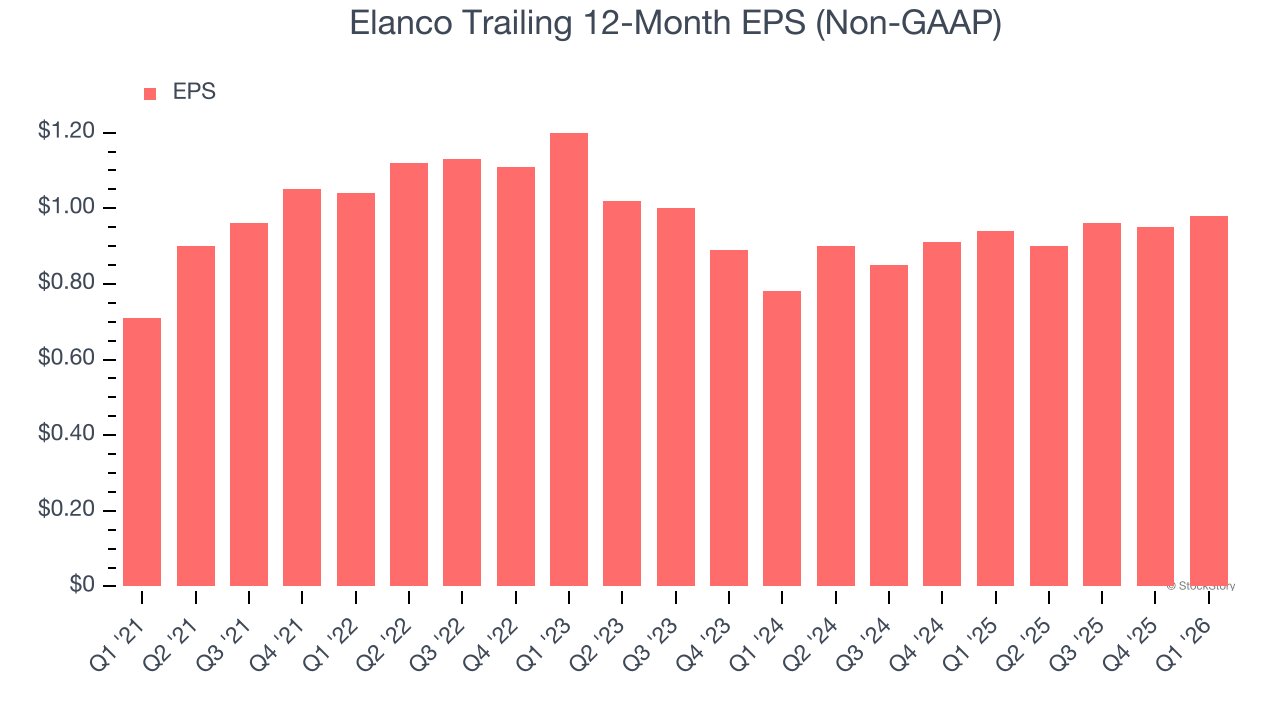
In Q1, Elanco reported adjusted EPS of $0.40, up from $0.37 in the same quarter last year. This print easily cleared analysts’ estimates, and shareholders should be content with the results. Over the next 12 months, Wall Street expects Elanco’s full-year EPS of $0.98 to grow 8.2%.
Key Takeaways from Elanco’s Q1 Results
We were impressed by how significantly Elanco blew past analysts’ revenue expectations this quarter. We were also glad its EPS outperformed Wall Street’s estimates. On the other hand, its EPS guidance for next quarter missed and its EBITDA guidance for next quarter fell short of Wall Street’s estimates. Overall, this print was mixed but still had some key positives. The stock traded up 3.3% to $23.75 immediately following the results.
Should you buy the stock or not? We think that the latest quarter is only one piece of the longer-term business quality puzzle. Quality, when combined with valuation, can help determine if the stock is a buy. We cover that in our actionable full research report which you can read here (it’s free).