

Healthcare distributor Cencora (NYSE:COR) missed Wall Street’s revenue expectations in Q1 CY2026 as sales rose 3.8% year on year to $78.36 billion. Its non-GAAP profit of $4.75 per share was in line with analysts’ consensus estimates.
Is now the time to buy Cencora? Find out by accessing our full research report, it’s free.
Cencora (COR) Q1 CY2026 Highlights:
- Revenue: $78.36 billion vs analyst estimates of $81.51 billion (3.8% year-on-year growth, 3.9% miss)
- Adjusted EPS: $4.75 vs analyst expectations of $4.73 (in line)
- Adjusted EBITDA: $1.39 billion vs analyst estimates of $1.44 billion (1.8% margin, 3.4% miss)
- Management slightly raised its full-year Adjusted EPS guidance to $17.78 at the midpoint
- Operating Margin: 1.5%, in line with the same quarter last year
- Free Cash Flow Margin: 1.5%, down from 4.3% in the same quarter last year
- Market Capitalization: $59.51 billion
Company Overview
Formerly known as AmerisourceBergen until its 2023 rebranding, Cencora (NYSE:COR) is a global pharmaceutical distribution company that connects manufacturers with healthcare providers while offering logistics, data analytics, and consulting services.
Revenue Growth
A company’s long-term performance is an indicator of its overall quality. Even a bad business can shine for one or two quarters, but a top-tier one grows for years. Thankfully, Cencora’s 10.9% annualized revenue growth over the last five years was decent. Its growth was slightly above the average healthcare company and shows its offerings resonate with customers.
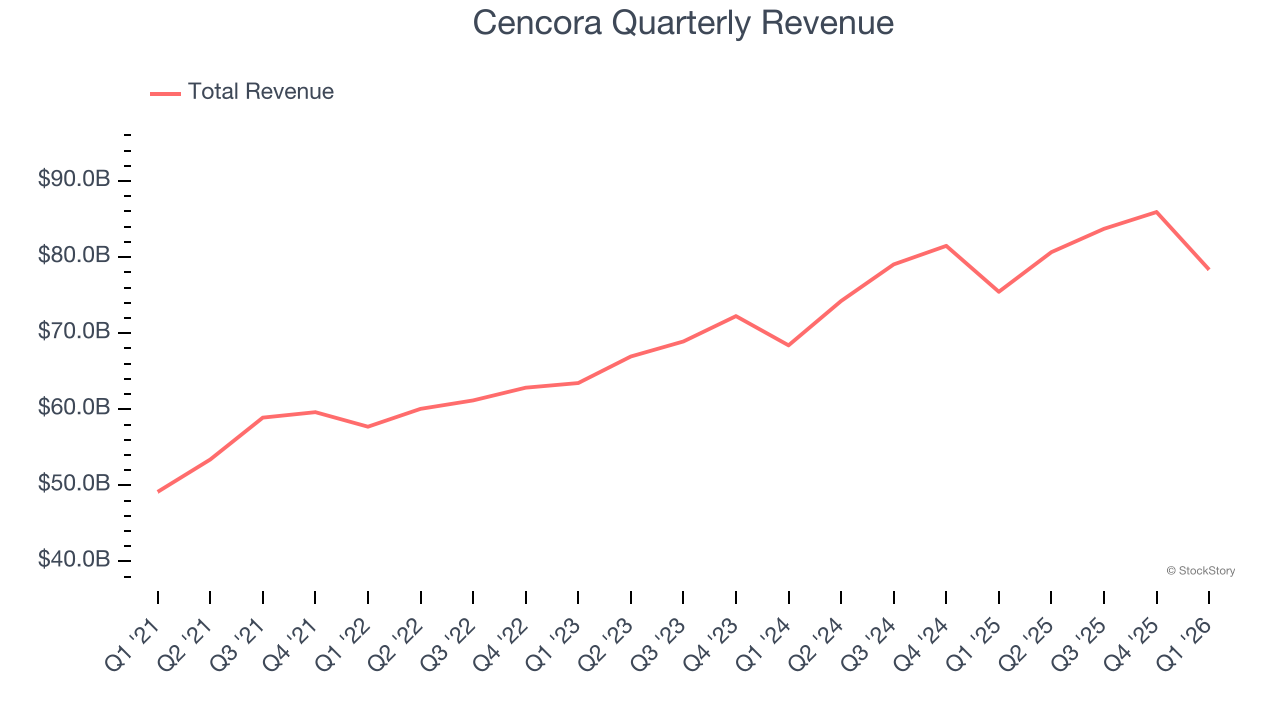
We at StockStory place the most emphasis on long-term growth, but within healthcare, a half-decade historical view may miss recent innovations or disruptive industry trends. Cencora’s annualized revenue growth of 9% over the last two years is below its five-year trend, but we still think the results were respectable. 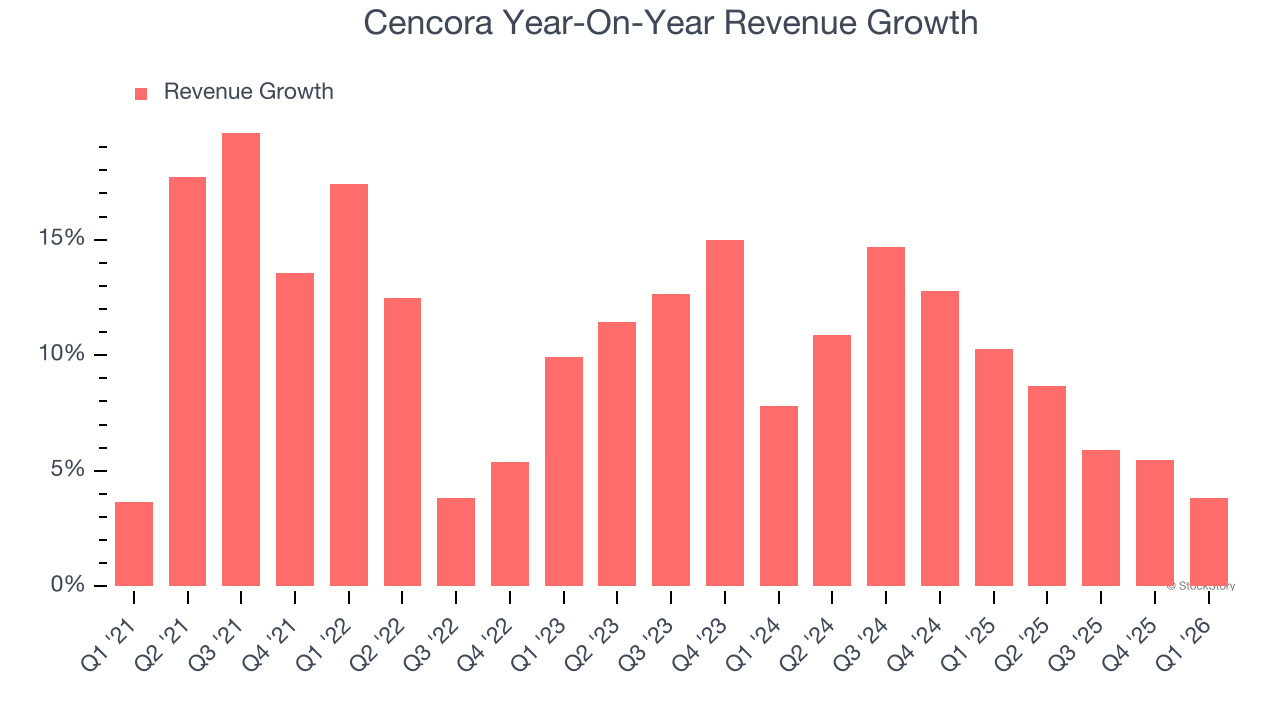
We can dig further into the company’s revenue dynamics by analyzing its most important segment, US Healthcare. Over the last two years, Cencora’s US Healthcare revenue averaged 7.1% year-on-year growth. This segment has lagged the company’s overall sales. 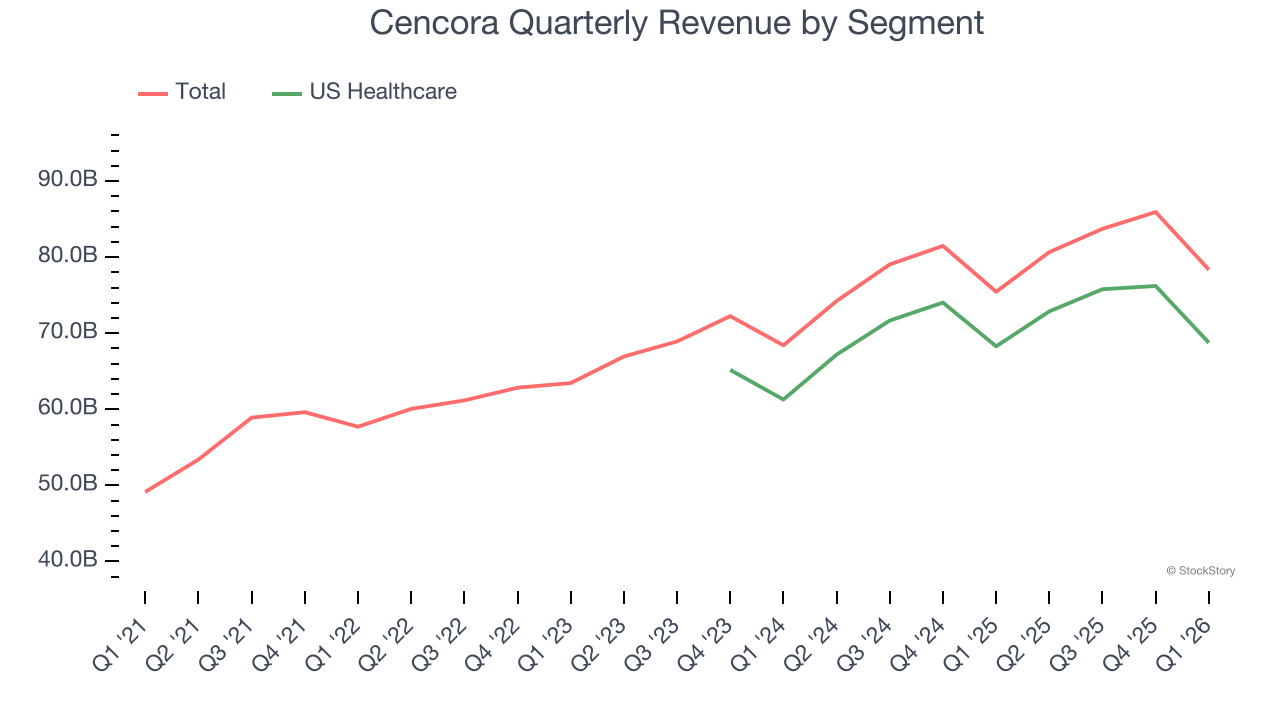
This quarter, Cencora’s revenue grew by 3.8% year on year to $78.36 billion, falling short of Wall Street’s estimates.
Looking ahead, sell-side analysts expect revenue to grow 9% over the next 12 months, similar to its two-year rate. This projection is particularly healthy for a company of its scale and suggests the market sees success for its products and services.
WHILE YOU’RE HERE: The Next Palantir? One satellite company captures images of every point on Earth. Every single day. The Pentagon wants it. Hedge funds are using it to beat earnings. You’ve probably never heard of it.
This is what the early days of Palantir looked like before it became a $437 billion giant. Same playbook. Different technology. If you missed Palantir, you need to see this. Claim The Stock Ticker for Free HERE.
Adjusted Operating Margin
Cencora’s adjusted operating margin has more or less stayed the same over the last 12 months , averaging 1.3% over the last five years. This profitability was lousy for a healthcare business and caused by its suboptimal cost structure.
Looking at the trend in its profitability, Cencora’s adjusted operating margin might fluctuated slightly but has generally stayed the same over the last five years. This raises questions about the company’s expense base because its revenue growth should have given it leverage on its fixed costs, resulting in better economies of scale and profitability.
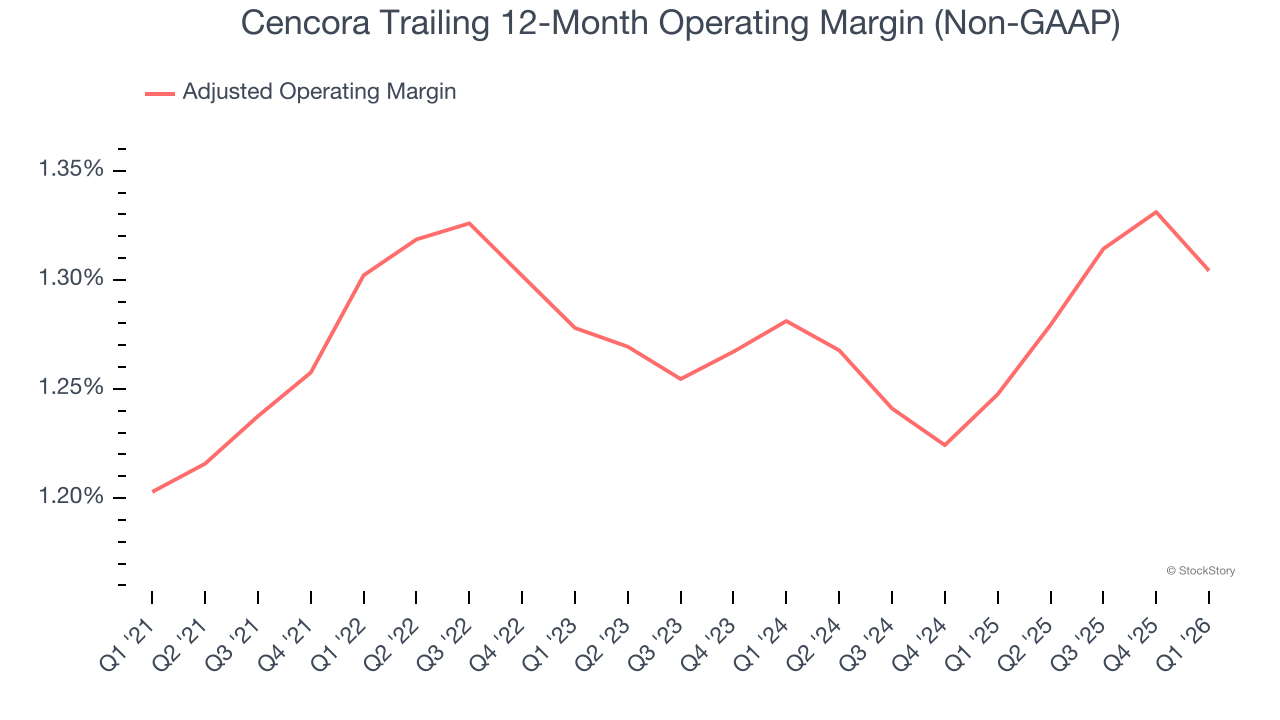
In Q1, Cencora generated an adjusted operating margin profit margin of 1.5%, in line with the same quarter last year. This indicates the company’s overall cost structure has been relatively stable.
Earnings Per Share
We track the long-term change in earnings per share (EPS) for the same reason as long-term revenue growth. Compared to revenue, however, EPS highlights whether a company’s growth is profitable.
Cencora’s EPS grew at 14.6% compounded annual growth rate over the last five years, higher than its 10.9% annualized revenue growth. However, this alone doesn’t tell us much about its business quality because its adjusted operating margin didn’t improve.
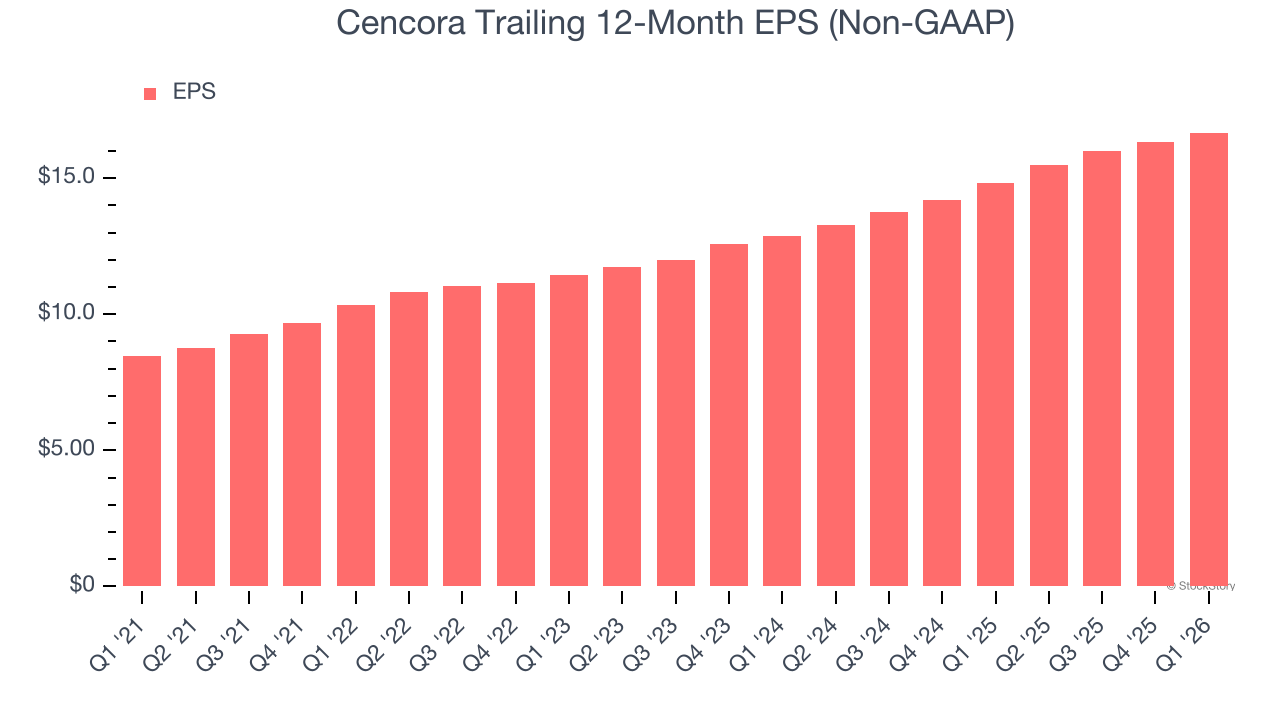
We can take a deeper look into Cencora’s earnings quality to better understand the drivers of its performance. A five-year view shows that Cencora has repurchased its stock, shrinking its share count by 5.8%. This tells us its EPS outperformed its revenue not because of increased operational efficiency but financial engineering, as buybacks boost per share earnings. 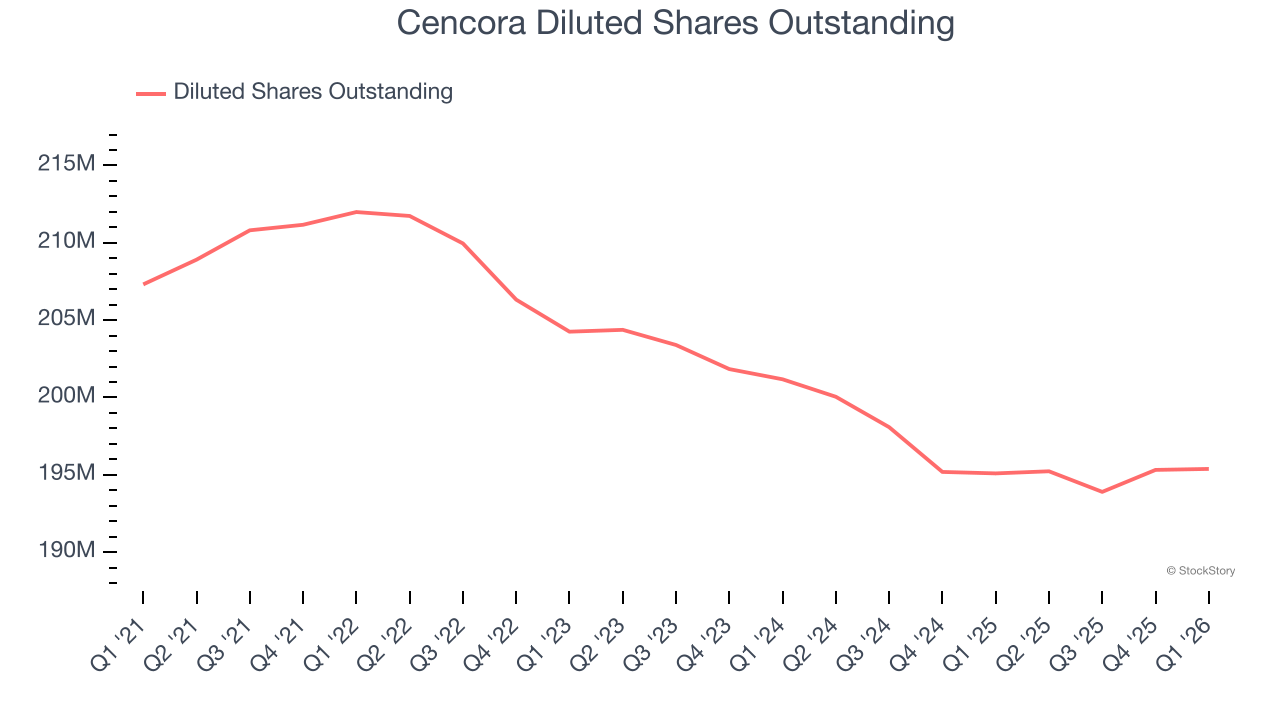
In Q1, Cencora reported adjusted EPS of $4.75, up from $4.42 in the same quarter last year. This print was close to analysts’ estimates. Over the next 12 months, Wall Street expects Cencora’s full-year EPS of $16.67 to grow 11%.
Key Takeaways from Cencora’s Q1 Results
It was good to see Cencora narrowly top analysts’ full-year EPS guidance expectations this quarter. On the other hand, its revenue missed. Overall, this was a weaker quarter. The stock remained flat at $305 immediately after reporting.
Cencora didn’t show it’s best hand this quarter, but does that create an opportunity to buy the stock right now? We think that the latest quarter is only one piece of the longer-term business quality puzzle. Quality, when combined with valuation, can help determine if the stock is a buy. We cover that in our actionable full research report which you can read here (it’s free).