

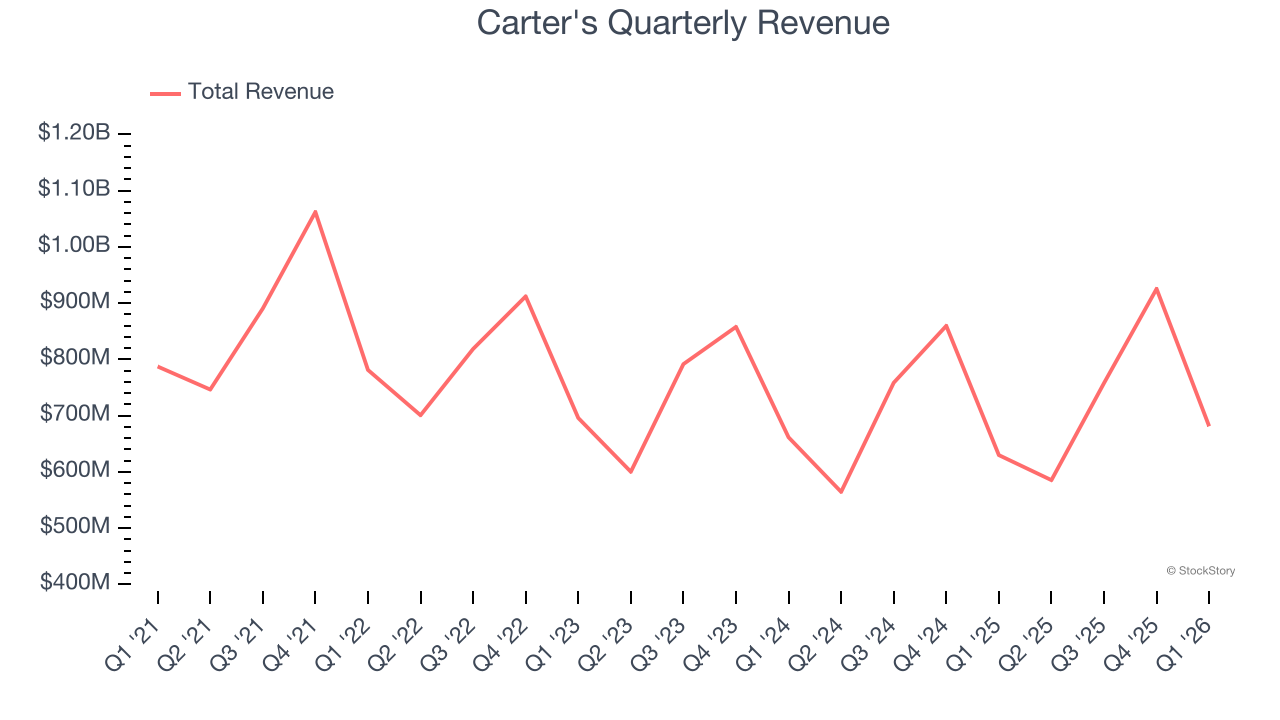
Children’s apparel manufacturer Carter’s (NYSE:CRI) reported Q1 CY2026 results topping the market’s revenue expectations, with sales up 8.1% year on year to $681.1 million. Its non-GAAP profit of $0.39 per share was significantly above analysts’ consensus estimates.
Is now the time to buy Carter's? Find out by accessing our full research report, it’s free.
Carter's (CRI) Q1 CY2026 Highlights:
- Revenue: $681.1 million vs analyst estimates of $660.1 million (8.1% year-on-year growth, 3.2% beat)
- Adjusted EPS: $0.39 vs analyst estimates of $0.12 (significant beat)
- Adjusted EBITDA: $42 million vs analyst estimates of $31.01 million (6.2% margin, 35.4% beat)
- Adjusted EPS guidance for Q2 CY2026 is $0.04 at the midpoint, above analyst estimates of -$0.14
- Operating Margin: 4.2%, in line with the same quarter last year
- Free Cash Flow was -$543,000 compared to -$59 million in the same quarter last year
- Same-Store Sales rose 10.5% year on year (-5.2% in the same quarter last year)
- Market Capitalization: $1.23 billion
Company Overview
Rumored to sell more than 10 products for every child born in the United States, Carter's (NYSE:CRI) is an American designer and marketer of children's apparel.
Revenue Growth
Examining a company’s long-term performance can provide clues about its quality. Even a bad business can shine for one or two quarters, but a top-tier one grows for years. Carter’s demand was weak over the last five years as its sales fell at a 1.4% annual rate. This wasn’t a great result and is a sign of poor business quality.
Long-term growth is the most important, but within consumer discretionary, product cycles are short and revenue can be hit-driven due to rapidly changing trends and consumer preferences. Carter’s revenue over the last two years was flat, sugggesting its demand was weak but stabilized after its initial drop. 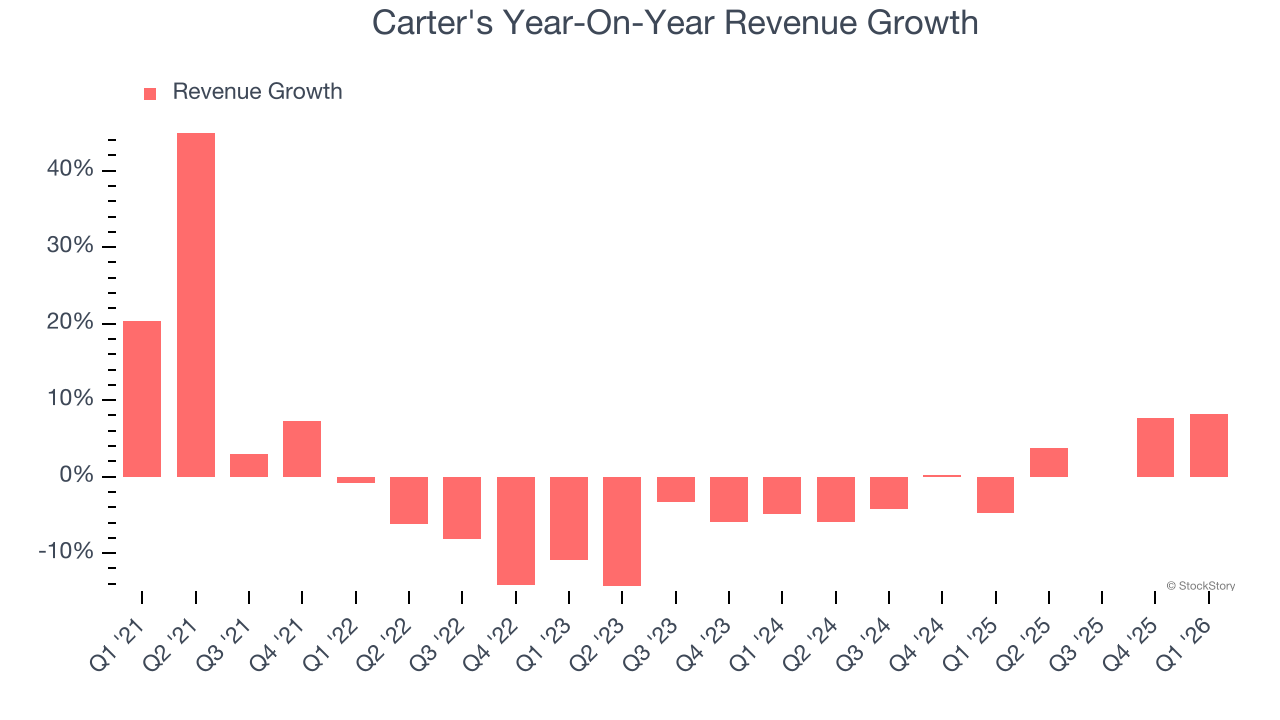
We can better understand the company’s revenue dynamics by analyzing its same-store sales, which show how much revenue its established locations generate. Over the last two years, Carter’s same-store sales averaged 1.9% year-on-year growth. This number doesn’t surprise us as it’s in line with its revenue growth. 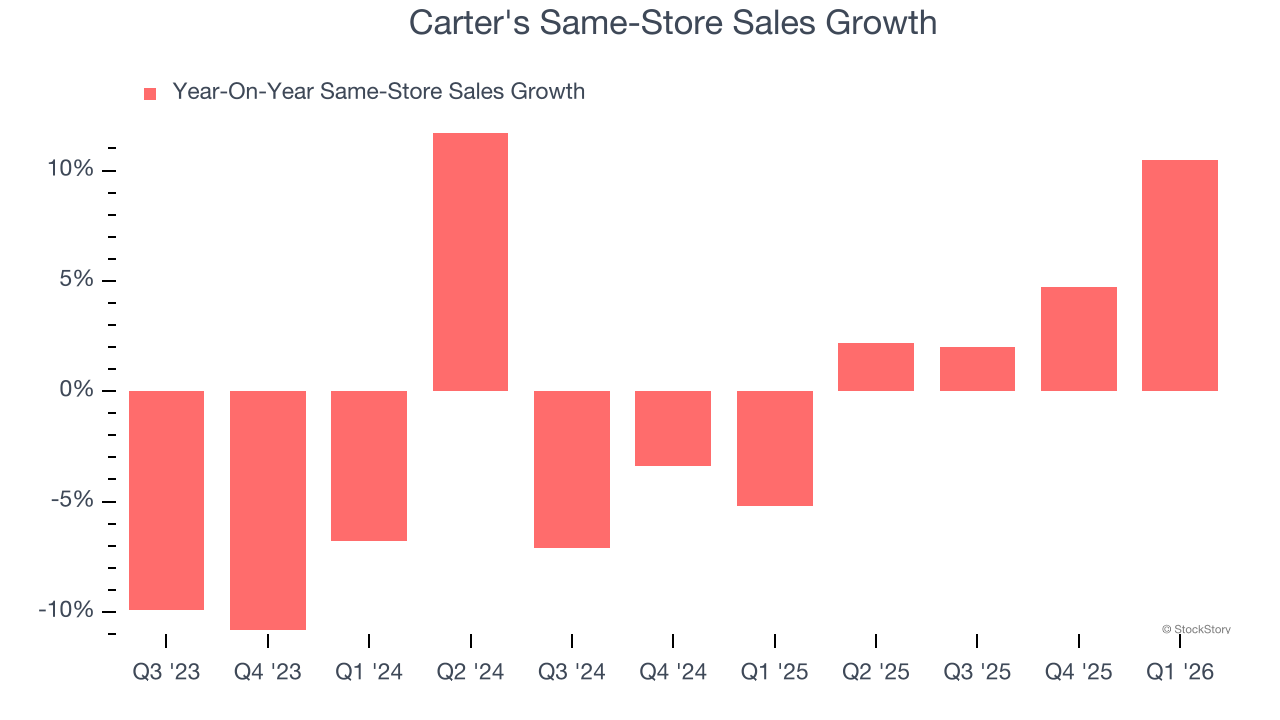
This quarter, Carter's reported year-on-year revenue growth of 8.1%, and its $681.1 million of revenue exceeded Wall Street’s estimates by 3.2%.
Looking ahead, sell-side analysts expect revenue to grow 2% over the next 12 months, similar to its two-year rate. While this projection implies its newer products and services will catalyze better top-line performance, it is still below the sector average.
WHILE YOU’RE HERE: The Next Palantir? One satellite company captures images of every point on Earth. Every single day. The Pentagon wants it. Hedge funds are using it to beat earnings. You’ve probably never heard of it.
This is what the early days of Palantir looked like before it became a $437 billion giant. Same playbook. Different technology. If you missed Palantir, you need to see this. Claim The Stock Ticker for Free HERE.
Operating Margin
Operating margin is an important measure of profitability as it shows the portion of revenue left after accounting for all core expenses – everything from the cost of goods sold to advertising and wages. It’s also useful for comparing profitability across companies with different levels of debt and tax rates because it excludes interest and taxes.
Carter’s operating margin has been trending down over the last 12 months and averaged 6.5% over the last two years. The company’s profitability was mediocre for a consumer discretionary business and shows it couldn’t pass its higher operating expenses onto its customers.
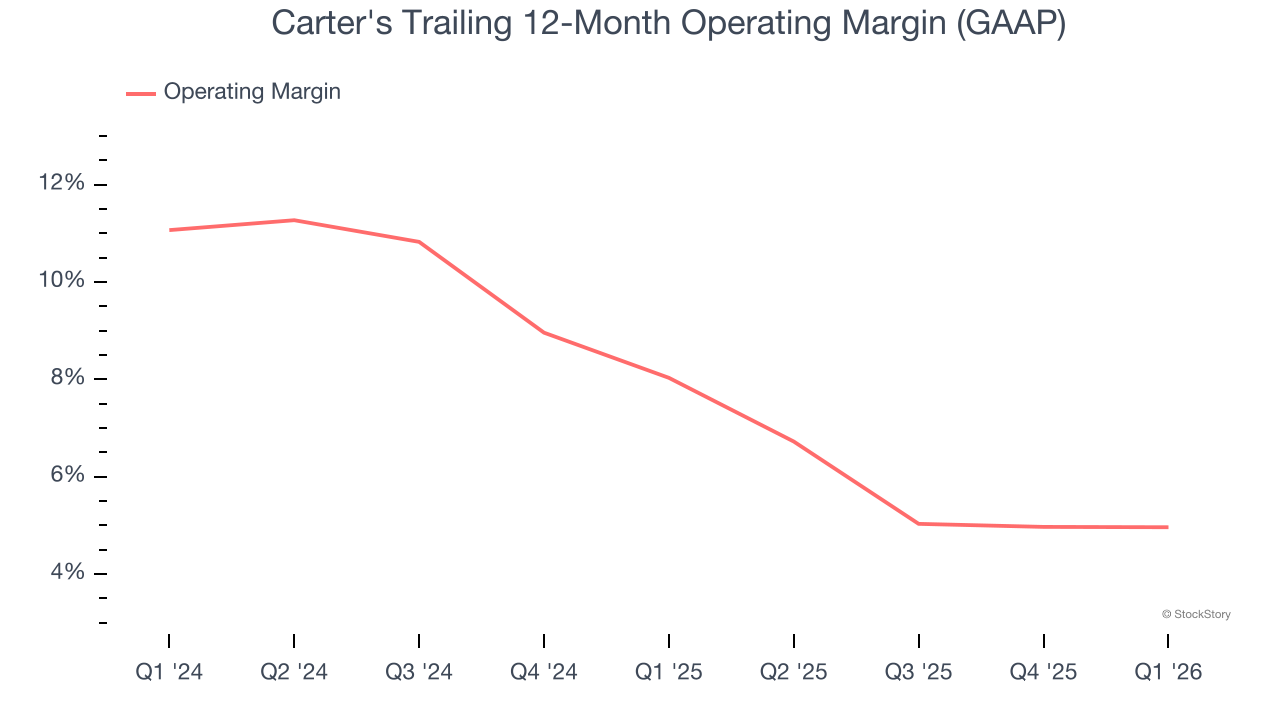
In Q1, Carter's generated an operating margin profit margin of 4.2%, in line with the same quarter last year. This indicates the company’s overall cost structure has been relatively stable.
Earnings Per Share
We track the long-term change in earnings per share (EPS) for the same reason as long-term revenue growth. Compared to revenue, however, EPS highlights whether a company’s growth is profitable.
Sadly for Carter's, its EPS declined by 14.3% annually over the last five years, more than its revenue. This tells us the company struggled because its fixed cost base made it difficult to adjust to shrinking demand.
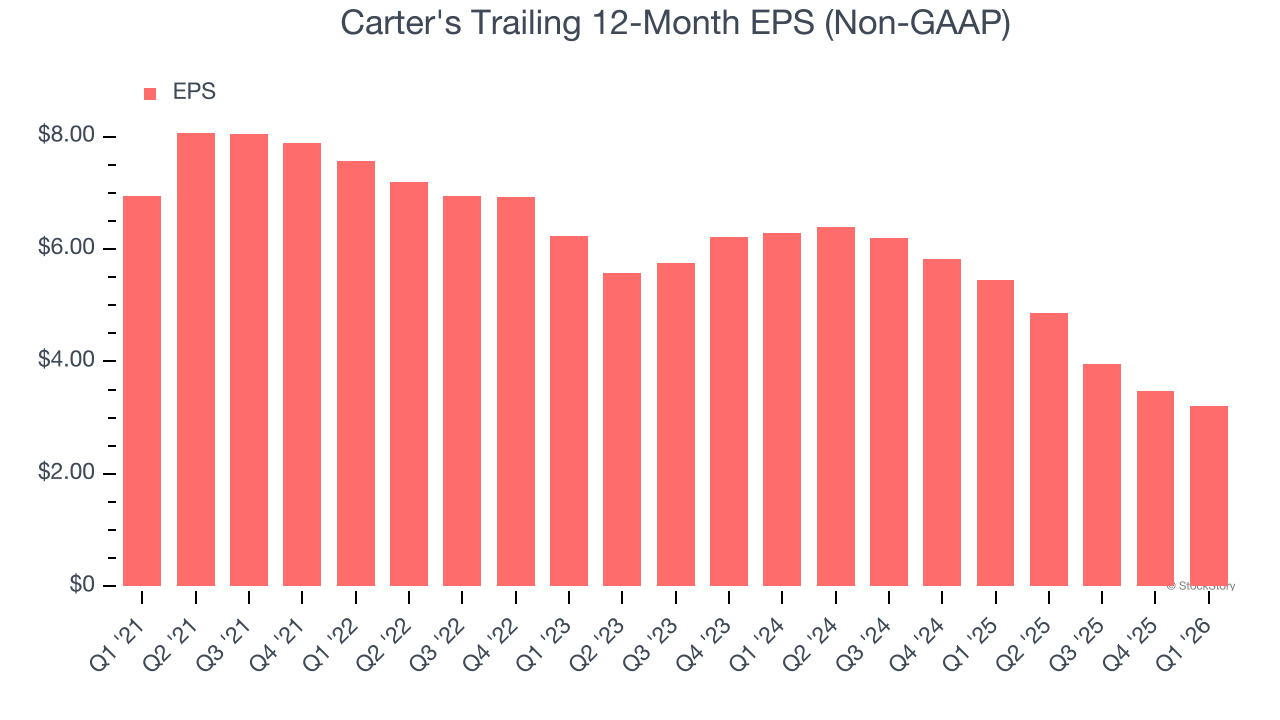
In Q1, Carter's reported adjusted EPS of $0.39, down from $0.66 in the same quarter last year. Despite falling year on year, this print easily cleared analysts’ estimates. Over the next 12 months, Wall Street expects Carter’s full-year EPS of $3.20 to stay about the same.
Key Takeaways from Carter’s Q1 Results
We were impressed by Carter’s optimistic EPS guidance for next quarter, which blew past analysts’ expectations. We were also glad its EPS outperformed Wall Street’s estimates. Zooming out, we think this was a good print with some key areas of upside. The stock traded up 1.5% to $33.84 immediately following the results.
Carter's had an encouraging quarter, but one earnings result doesn’t necessarily make the stock a buy. Let’s see if this is a good investment. What happened in the latest quarter matters, but not as much as longer-term business quality and valuation, when deciding whether to invest in this stock. We cover that in our actionable full research report which you can read here (it’s free).