

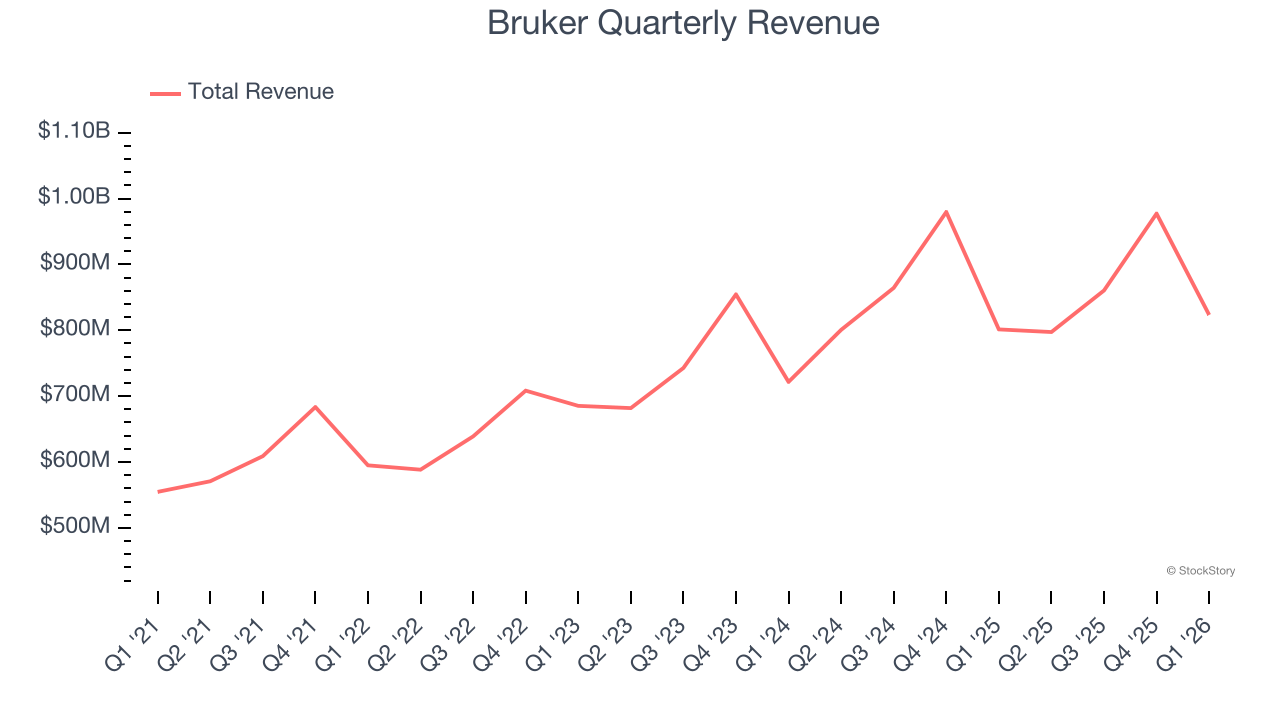
Scientific instrument company Bruker (NASDAQ:BRKR). announced better-than-expected revenue in Q1 CY2026, with sales up 2.7% year on year to $823.4 million. The company expects the full year’s revenue to be around $3.59 billion, close to analysts’ estimates. Its non-GAAP profit of $0.31 per share was 34.8% above analysts’ consensus estimates.
Is now the time to buy Bruker? Find out by accessing our full research report, it’s free.
Bruker (BRKR) Q1 CY2026 Highlights:
- Revenue: $823.4 million vs analyst estimates of $796.5 million (2.7% year-on-year growth, 3.4% beat)
- Adjusted EPS: $0.31 vs analyst estimates of $0.23 (34.8% beat)
- Adjusted EBITDA: $68.5 million vs analyst estimates of $98.49 million (8.3% margin, 30.4% miss)
- The company reconfirmed its revenue guidance for the full year of $3.59 billion at the midpoint
- Management reiterated its full-year Adjusted EPS guidance of $2.13 at the midpoint
- Operating Margin: 1.2%, down from 4% in the same quarter last year
- Free Cash Flow Margin: 5.7%, similar to the same quarter last year
- Organic Revenue fell 4.4% year on year (beat)
- Market Capitalization: $5.79 billion
Company Overview
With roots dating back to the pioneering days of nuclear magnetic resonance technology, Bruker (NASDAQ:BRKR) develops and manufactures high-performance scientific instruments that enable researchers and industrial analysts to explore materials at microscopic, molecular, and cellular levels.
Revenue Growth
Examining a company’s long-term performance can provide clues about its quality. Even a bad business can shine for one or two quarters, but a top-tier one grows for years. Thankfully, Bruker’s 10.3% annualized revenue growth over the last five years was decent. Its growth was slightly above the average healthcare company and shows its offerings resonate with customers.
We at StockStory place the most emphasis on long-term growth, but within healthcare, a half-decade historical view may miss recent innovations or disruptive industry trends. Bruker’s recent performance shows its demand has slowed as its annualized revenue growth of 7.4% over the last two years was below its five-year trend. We’re wary when companies in the sector see decelerations in revenue growth, as it could signal changing consumer tastes aided by low switching costs. 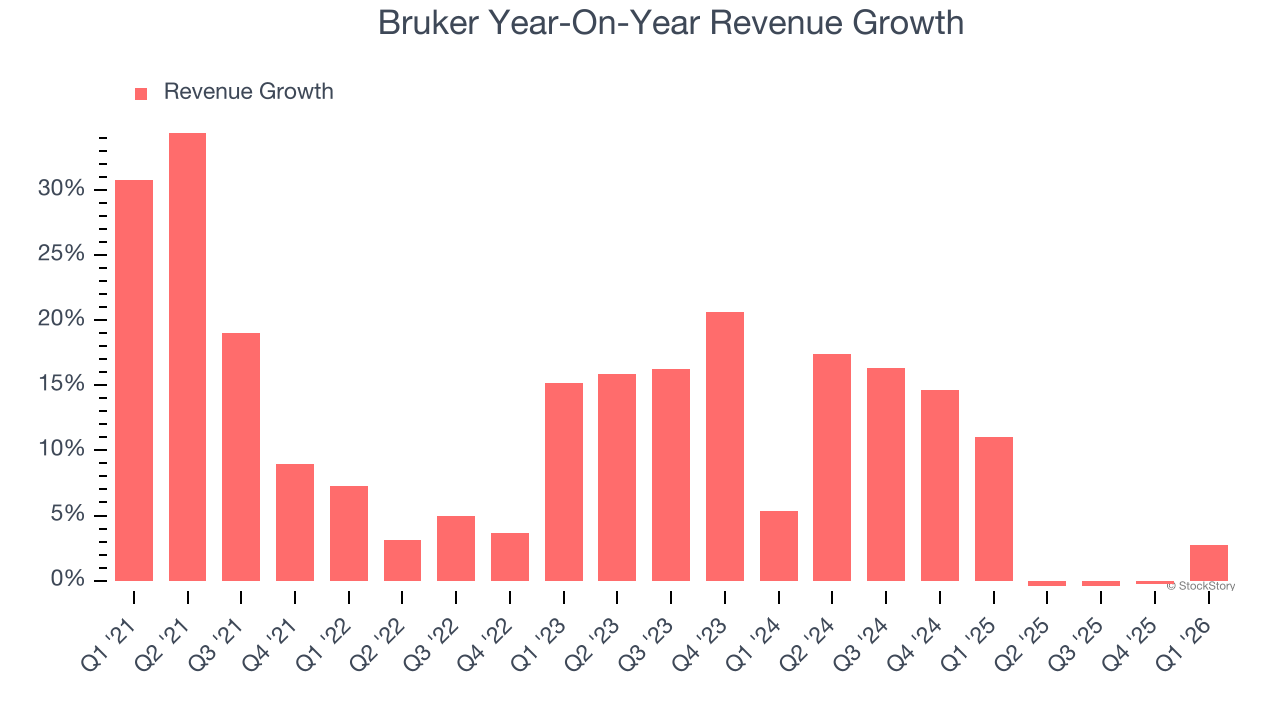
Bruker also reports organic revenue, which strips out one-time events like acquisitions and currency fluctuations that don’t accurately reflect its fundamentals. Over the last two years, Bruker’s organic revenue was flat. Because this number is lower than its two-year revenue growth, we can see that some mixture of acquisitions and foreign exchange rates boosted its headline results. 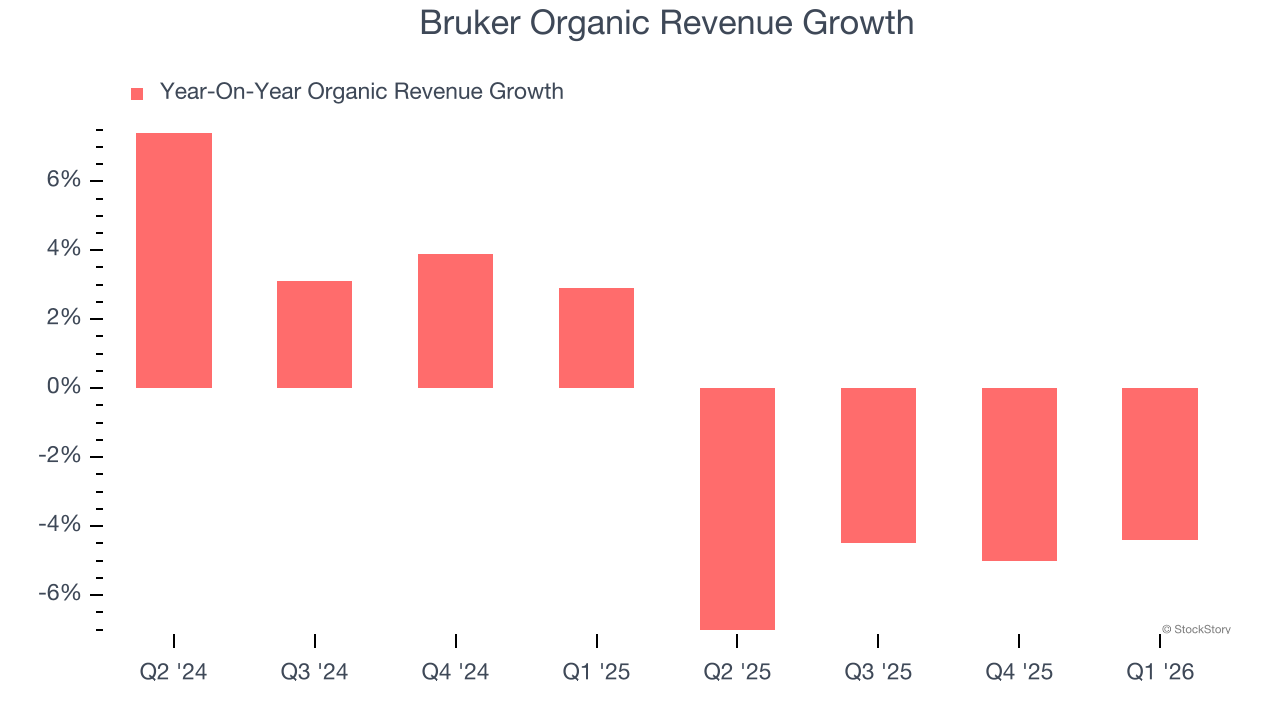
This quarter, Bruker reported modest year-on-year revenue growth of 2.7% but beat Wall Street’s estimates by 3.4%.
Looking ahead, sell-side analysts expect revenue to grow 4.5% over the next 12 months, a slight deceleration versus the last two years. This projection is underwhelming and indicates its products and services will face some demand challenges.
WHILE YOU’RE HERE: The Next Palantir? One satellite company captures images of every point on Earth. Every single day. The Pentagon wants it. Hedge funds are using it to beat earnings. You’ve probably never heard of it.
This is what the early days of Palantir looked like before it became a $437 billion giant. Same playbook. Different technology. If you missed Palantir, you need to see this. Claim The Stock Ticker for Free HERE.
Adjusted Operating Margin
Adjusted operating margin is one of the best measures of profitability because it tells us how much money a company takes home after subtracting all core expenses, like marketing and R&D. It also removes various one-time costs to paint a better picture of normalized profits.
Bruker has managed its cost base well over the last five years. It demonstrated solid profitability for a healthcare business, producing an average adjusted operating margin of 15.9%.
Looking at the trend in its profitability, Bruker’s adjusted operating margin decreased by 9.8 percentage points over the last five years. The company’s two-year trajectory also shows it failed to get its profitability back to the peak as its margin fell by 7 percentage points. This performance was poor no matter how you look at it - it shows its expenses were rising and it couldn’t pass those costs onto its customers.
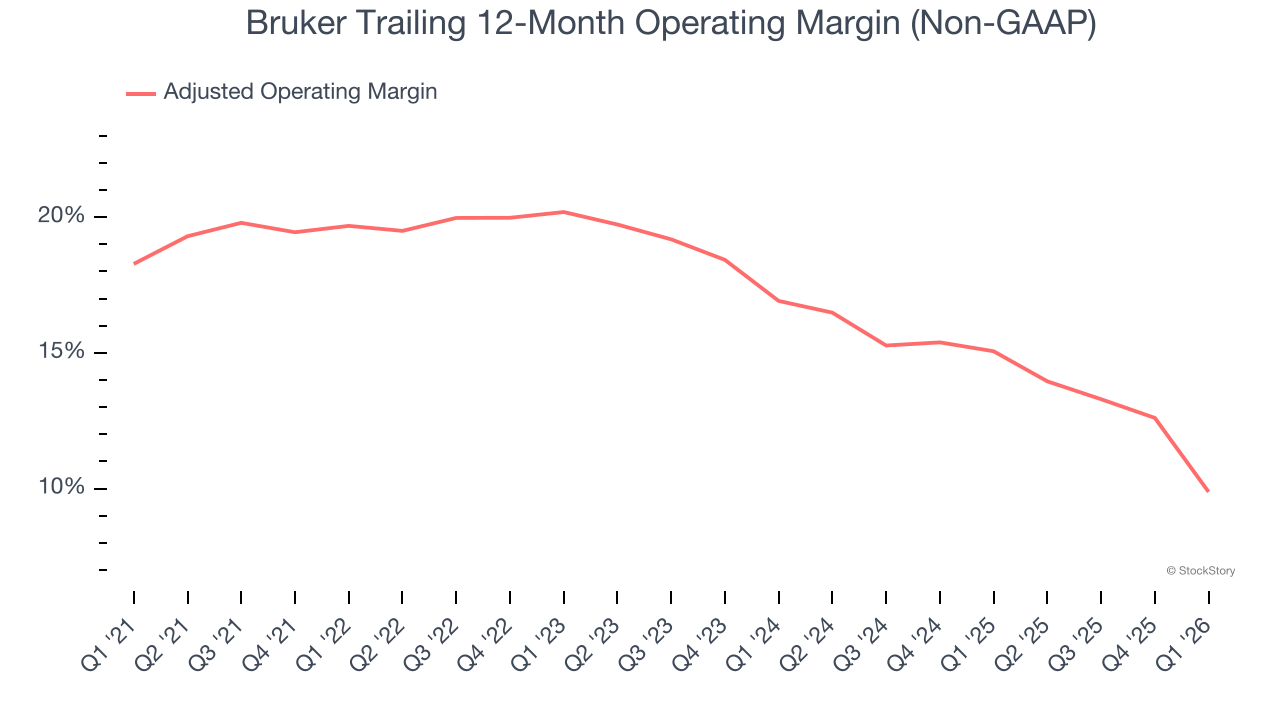
In Q1, Bruker generated an adjusted operating margin profit margin of 1.2%, down 11.5 percentage points year on year. This contraction shows it was less efficient because its expenses grew faster than its revenue.
Earnings Per Share
We track the long-term change in earnings per share (EPS) for the same reason as long-term revenue growth. Compared to revenue, however, EPS highlights whether a company’s growth is profitable.
Bruker’s flat EPS over the last five years was below its 10.3% annualized revenue growth. This tells us the company became less profitable on a per-share basis as it expanded.
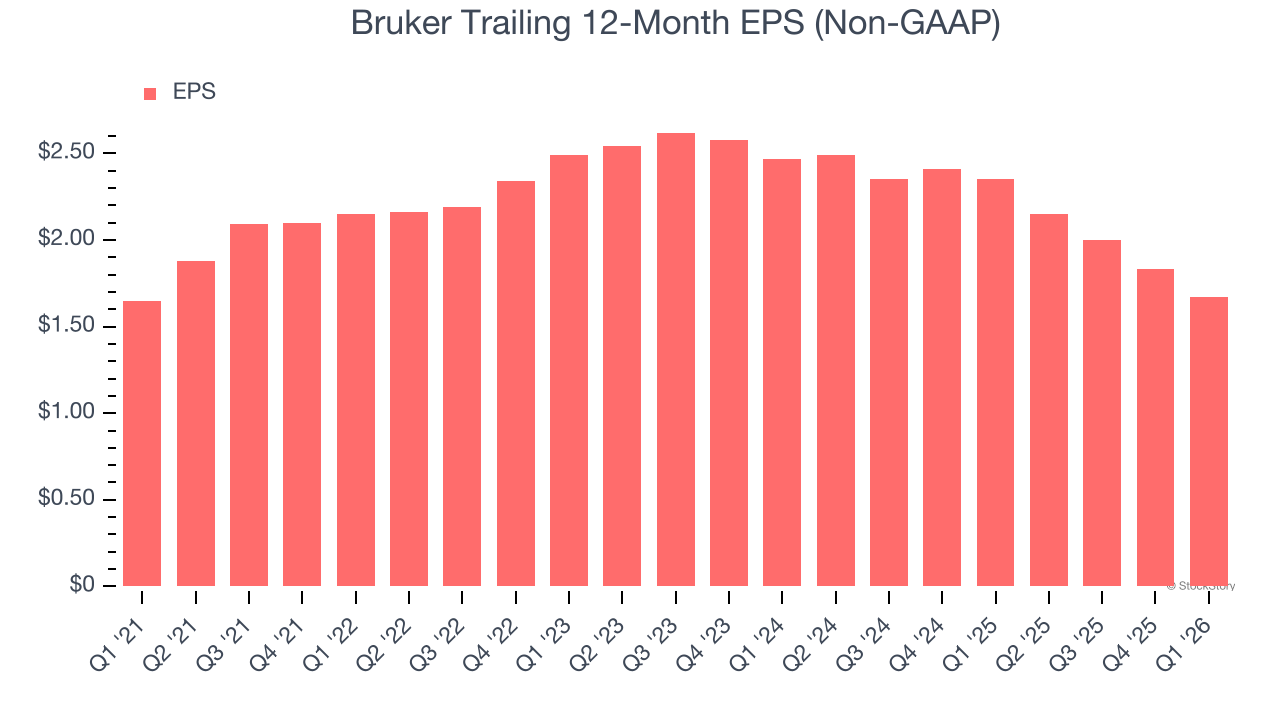
Diving into the nuances of Bruker’s earnings can give us a better understanding of its performance. As we mentioned earlier, Bruker’s adjusted operating margin declined by 9.8 percentage points over the last five years. This was the most relevant factor (aside from the revenue impact) behind its lower earnings; interest expenses and taxes can also affect EPS but don’t tell us as much about a company’s fundamentals.
In Q1, Bruker reported adjusted EPS of $0.31, down from $0.47 in the same quarter last year. Despite falling year on year, this print easily cleared analysts’ estimates. Over the next 12 months, Wall Street expects Bruker’s full-year EPS of $1.67 to grow 37.2%.
Key Takeaways from Bruker’s Q1 Results
It was good to see Bruker beat analysts’ EPS expectations this quarter. We were also glad its revenue outperformed Wall Street’s estimates. Overall, we think this was still a solid quarter with some key areas of upside. The stock traded up 4.4% to $39.69 immediately following the results.
Bruker put up rock-solid earnings, but one quarter doesn’t necessarily make the stock a buy. Let’s see if this is a good investment. We think that the latest quarter is only one piece of the longer-term business quality puzzle. Quality, when combined with valuation, can help determine if the stock is a buy. We cover that in our actionable full research report which you can read here (it’s free).