

Cruise and exploration company Lindblad Expeditions (NASDAQ:LIND) beat Wall Street’s revenue expectations in Q1 CY2026, with sales up 15.7% year on year to $208 million. On the other hand, the company’s full-year revenue guidance of $825 million at the midpoint came in 1.7% below analysts’ estimates. Its GAAP profit of $0.09 per share was significantly above analysts’ consensus estimates.
Is now the time to buy Lindblad Expeditions? Find out by accessing our full research report, it’s free.
Lindblad Expeditions (LIND) Q1 CY2026 Highlights:
- Revenue: $208 million vs analyst estimates of $197.9 million (15.7% year-on-year growth, 5.1% beat)
- EPS (GAAP): $0.09 vs analyst estimates of $0.01 (significant beat)
- Adjusted EBITDA: $34.83 million vs analyst estimates of $33.65 million (16.7% margin, 3.5% beat)
- The company reconfirmed its revenue guidance for the full year of $825 million at the midpoint
- EBITDA guidance for the full year is $135 million at the midpoint, below analyst estimates of $136.8 million
- Operating Margin: 7.5%, up from 6% in the same quarter last year
- Market Capitalization: $1.16 billion
Natalya Leahy, Chief Executive Officer, said: "In a complex macro and geopolitical environment, our team delivered another record quarter, achieving 93% occupancy- highest in the Company's history, record yields, and 16% EBITDA growth. These results reflect the strength of our strategy and execution, and we remain confident in our ability to drive long-term value as we navigate external dynamics."
Company Overview
Founded by explorer Sven-Olof Lindblad in 1979, Lindblad Expeditions (NASDAQ:LIND) offers cruising experiences to remote destinations in partnership with National Geographic.
Revenue Growth
Examining a company’s long-term performance can provide clues about its quality. Even a bad business can shine for one or two quarters, but a top-tier one grows for years. Luckily, Lindblad Expeditions’s sales grew at an incredible 208% compounded annual growth rate over the last five years. Its growth beat the average consumer discretionary company and shows its offerings resonate with customers.
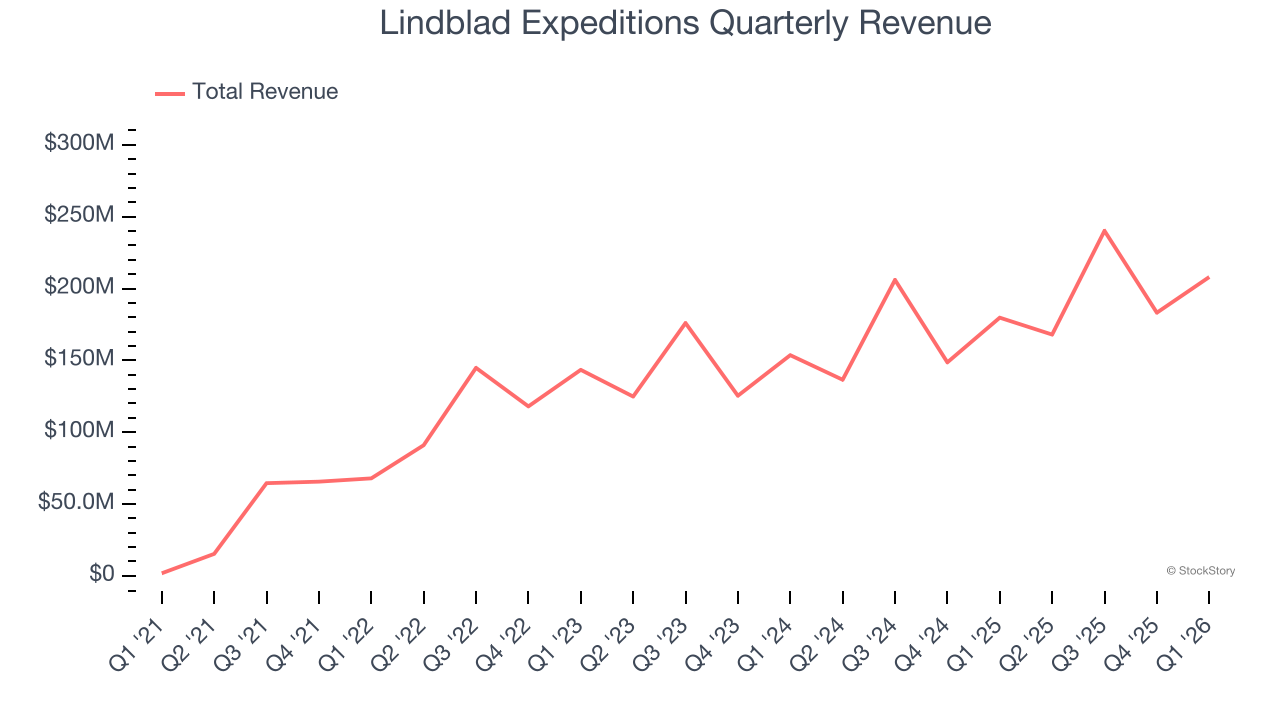
We at StockStory place the most emphasis on long-term growth, but within consumer discretionary, a stretched historical view may miss a company riding a successful new property or trend. Lindblad Expeditions’s recent performance shows its demand has slowed significantly as its annualized revenue growth of 17.4% over the last two years was well below its five-year trend. 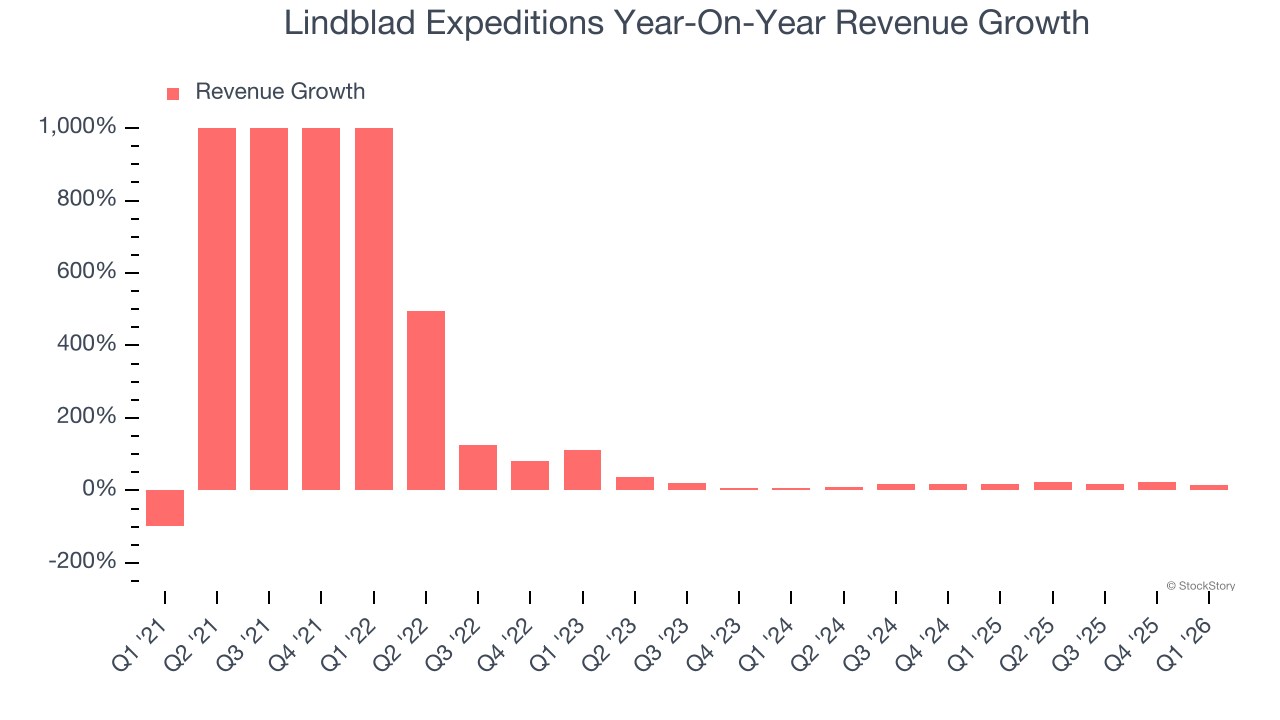
This quarter, Lindblad Expeditions reported year-on-year revenue growth of 15.7%, and its $208 million of revenue exceeded Wall Street’s estimates by 5.1%.
Looking ahead, sell-side analysts expect revenue to grow 6.8% over the next 12 months, a deceleration versus the last two years. This projection doesn't excite us and implies its products and services will face some demand challenges.
ALSO WORTH WATCHING: Nvidia’s Quiet Partner. Nvidia’s chips cost a hundred grand. The connectors that make them work cost even more. One company makes them all.
Every AI server needs specialized infrastructure the chip companies don’t make. High-speed cables. Power connectors. Thermal sensors. This 90-year-old company built a monopoly on it. The AI boom just started. This stock is still flying under the radar. Claim The Stock Ticker Here for FREE.
Operating Margin
Operating margin is an important measure of profitability as it shows the portion of revenue left after accounting for all core expenses – everything from the cost of goods sold to advertising and wages. It’s also useful for comparing profitability across companies with different levels of debt and tax rates because it excludes interest and taxes.
Lindblad Expeditions’s operating margin has been trending up over the last 12 months and averaged 5.8% over the last two years. The company’s higher efficiency is a breath of fresh air, but its suboptimal cost structure means it still sports inadequate profitability for a consumer discretionary business.
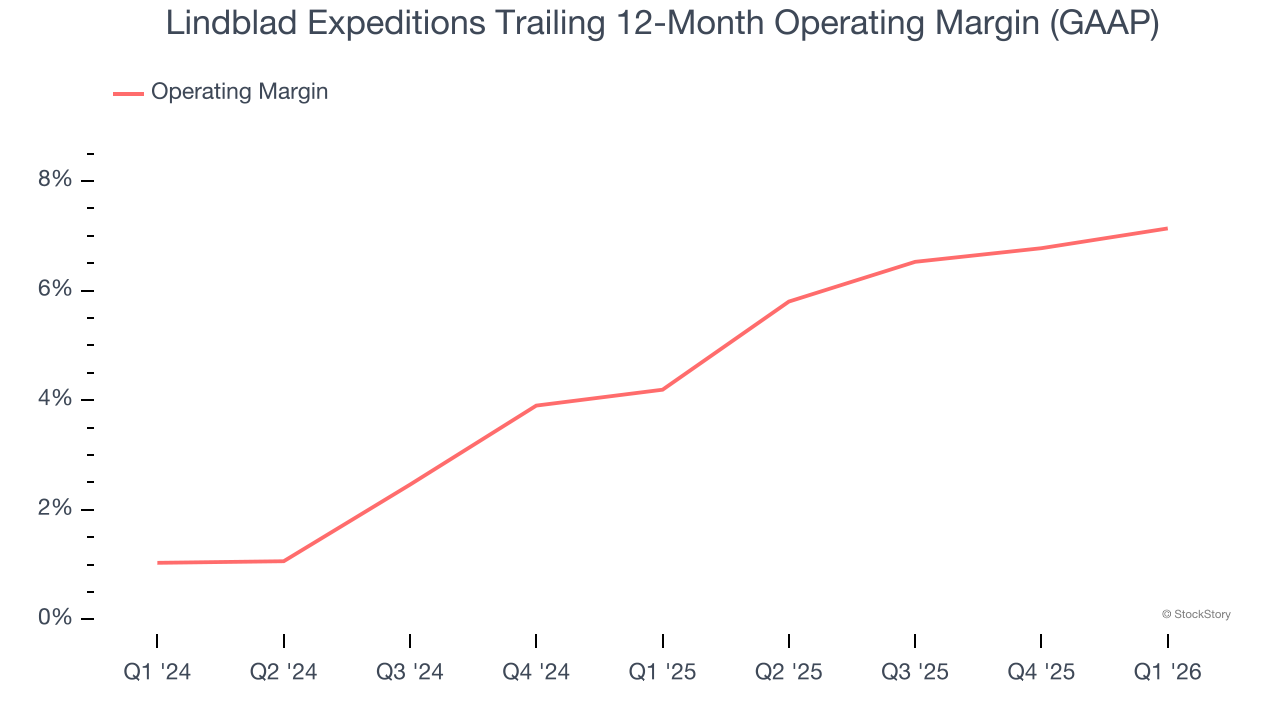
This quarter, Lindblad Expeditions generated an operating margin profit margin of 7.5%, up 1.5 percentage points year on year. This increase was a welcome development and shows it was more efficient.
Earnings Per Share
We track the long-term change in earnings per share (EPS) for the same reason as long-term revenue growth. Compared to revenue, however, EPS highlights whether a company’s growth is profitable.
Although Lindblad Expeditions’s full-year earnings are still negative, it reduced its losses and improved its EPS by 27% annually over the last five years. The next few quarters will be critical for assessing its long-term profitability.
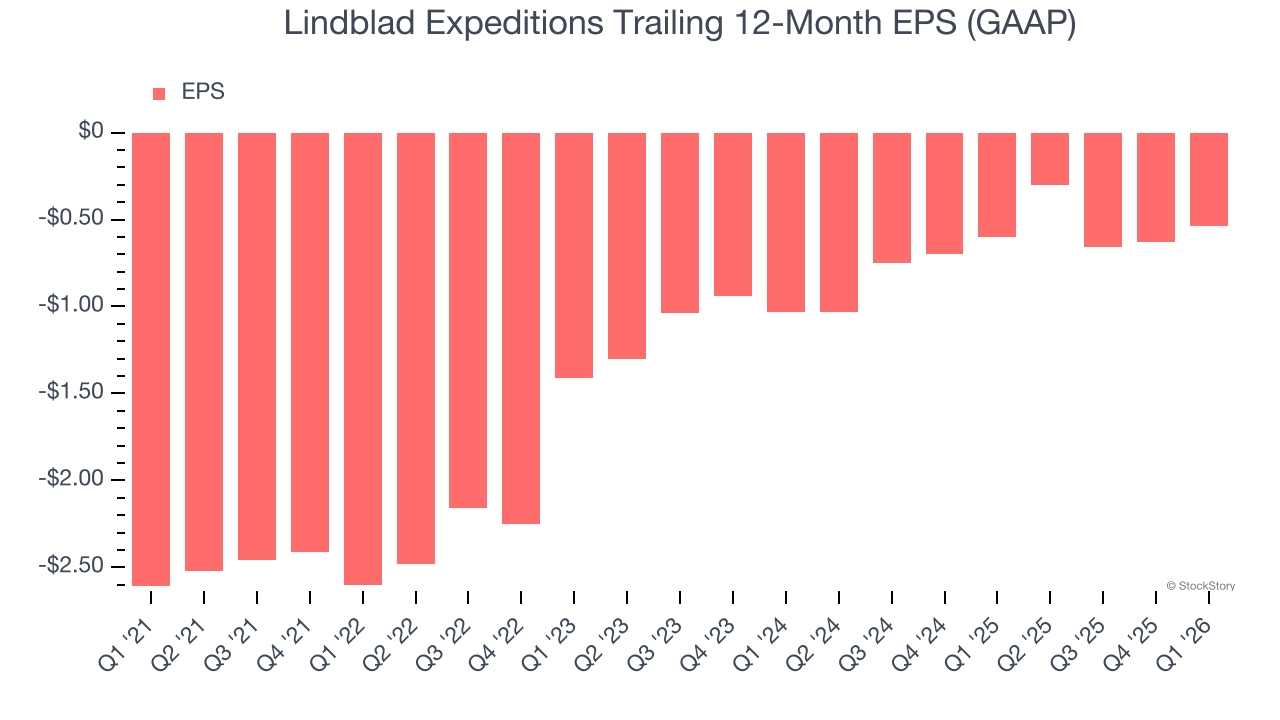
In Q1, Lindblad Expeditions reported EPS of $0.09, up from $0 in the same quarter last year. This print easily cleared analysts’ estimates, and shareholders should be content with the results. Over the next 12 months, Wall Street is optimistic. Analysts forecast Lindblad Expeditions’s full-year EPS of negative $0.54 will flip to positive $0.08.
Key Takeaways from Lindblad Expeditions’s Q1 Results
It was good to see Lindblad Expeditions beat analysts’ EPS expectations this quarter. We were also glad its adjusted operating income outperformed Wall Street’s estimates. On the other hand, its full-year revenue guidance missed and its full-year EBITDA guidance fell slightly short of Wall Street’s estimates. Overall, this print was mixed but still had some key positives. The stock remained flat at $17.77 immediately after reporting.
Is Lindblad Expeditions an attractive investment opportunity at the current price? We think that the latest quarter is only one piece of the longer-term business quality puzzle. Quality, when combined with valuation, can help determine if the stock is a buy. We cover that in our actionable full research report which you can read here (it’s free).