

Ultra low-cost airline Frontier Group Holdings (NASDAQ:ULCC) missed Wall Street’s revenue expectations in Q1 CY2026, but sales rose 8.8% year on year to $992 million. Its non-GAAP loss of $0.30 per share was 17% above analysts’ consensus estimates.
Is now the time to buy Frontier? Find out by accessing our full research report, it’s free.
Frontier (ULCC) Q1 CY2026 Highlights:
- Revenue: $992 million vs analyst estimates of $1.05 billion (8.8% year-on-year growth, 5.4% miss)
- Adjusted EPS: -$0.30 vs analyst estimates of -$0.36 (17% beat)
- Adjusted EBITDA: $190 million vs analyst estimates of $163 million (19.2% margin, 16.6% beat)
- Adjusted EPS guidance for Q2 CY2026 is -$0.53 at the midpoint, above analyst estimates of -$0.60
- Operating Margin: -28.5%, down from -5% in the same quarter last year
- Revenue passenger miles: 7.69 billion, up 232 million year on year
- Market Capitalization: $939.6 million
Company Overview
Recognizable for the colorful animals adorning each aircraft tail, Frontier Group Holdings (NASDAQ:ULCC) is an ultra low-cost airline that provides budget-friendly flights throughout the United States and select international destinations in the Americas.
Revenue Growth
A company’s long-term performance is an indicator of its overall quality. Any business can put up a good quarter or two, but many enduring ones grow for years. Over the last five years, Frontier grew its sales at a 31.2% compounded annual growth rate. Though this growth is acceptable on an absolute basis, we need to see more than just topline growth for the consumer discretionary sector, which can display significant earnings volatility. This means our bar for the sector is particularly high, reflecting the non-essential and hit-driven nature of the products and services offered. Additionally, five-year CAGR starts around Covid, when revenue was depressed then rebounded.
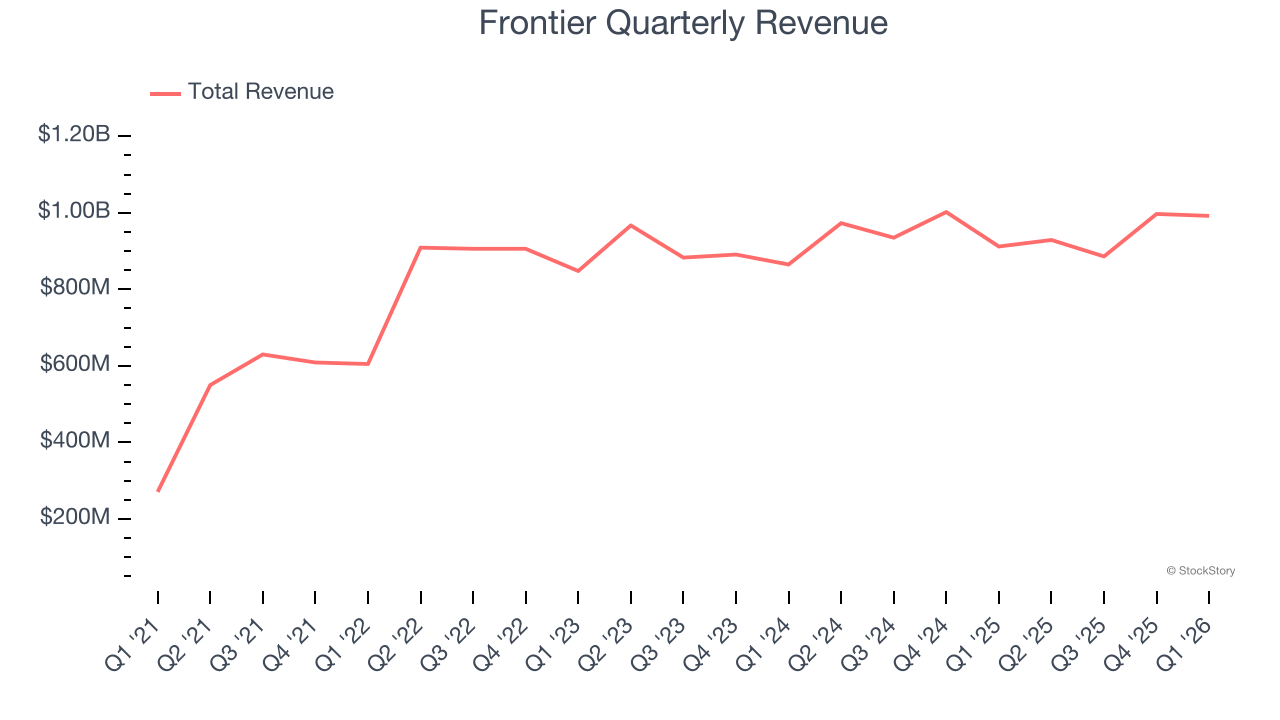
We at StockStory place the most emphasis on long-term growth, but within consumer discretionary, a stretched historical view may miss a company riding a successful new property or trend. Frontier’s recent performance shows its demand has slowed as its annualized revenue growth of 2.7% over the last two years was below its five-year trend. We’re wary when companies in the sector see decelerations in revenue growth, as it could signal changing consumer tastes aided by low switching costs. 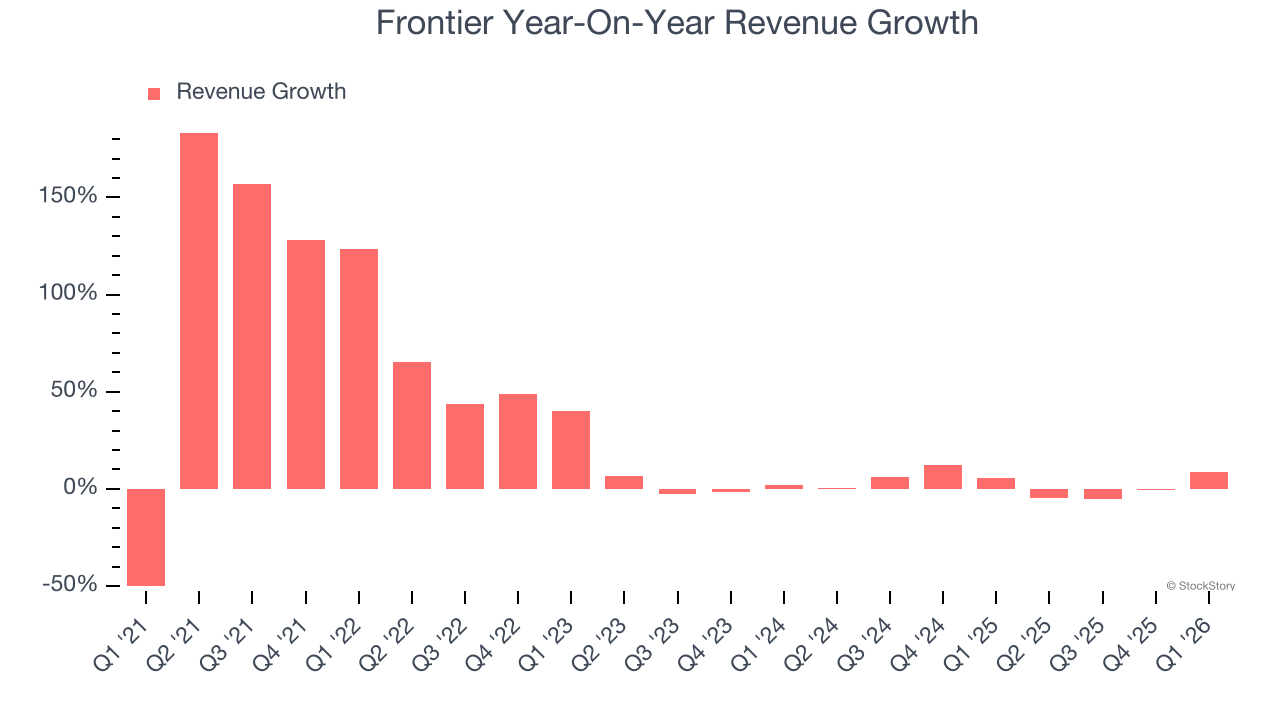
This quarter, Frontier’s revenue grew by 8.8% year on year to $992 million, missing Wall Street’s estimates.
Looking ahead, sell-side analysts expect revenue to grow 26.5% over the next 12 months, an improvement versus the last two years. This projection is eye-popping and implies its newer products and services will spur better top-line performance.
ALSO WORTH WATCHING: Nvidia’s Quiet Partner. Nvidia’s chips cost a hundred grand. The connectors that make them work cost even more. One company makes them all.
Every AI server needs specialized infrastructure the chip companies don’t make. High-speed cables. Power connectors. Thermal sensors. This 90-year-old company built a monopoly on it. The AI boom just started. This stock is still flying under the radar. Claim The Stock Ticker Here for FREE.
Operating Margin
Frontier’s operating margin has shrunk over the last 12 months and averaged negative 4.5% over the last two years. Unprofitable consumer discretionary companies with falling margins deserve extra scrutiny because they’re spending loads of money to stay relevant, an unsustainable practice.
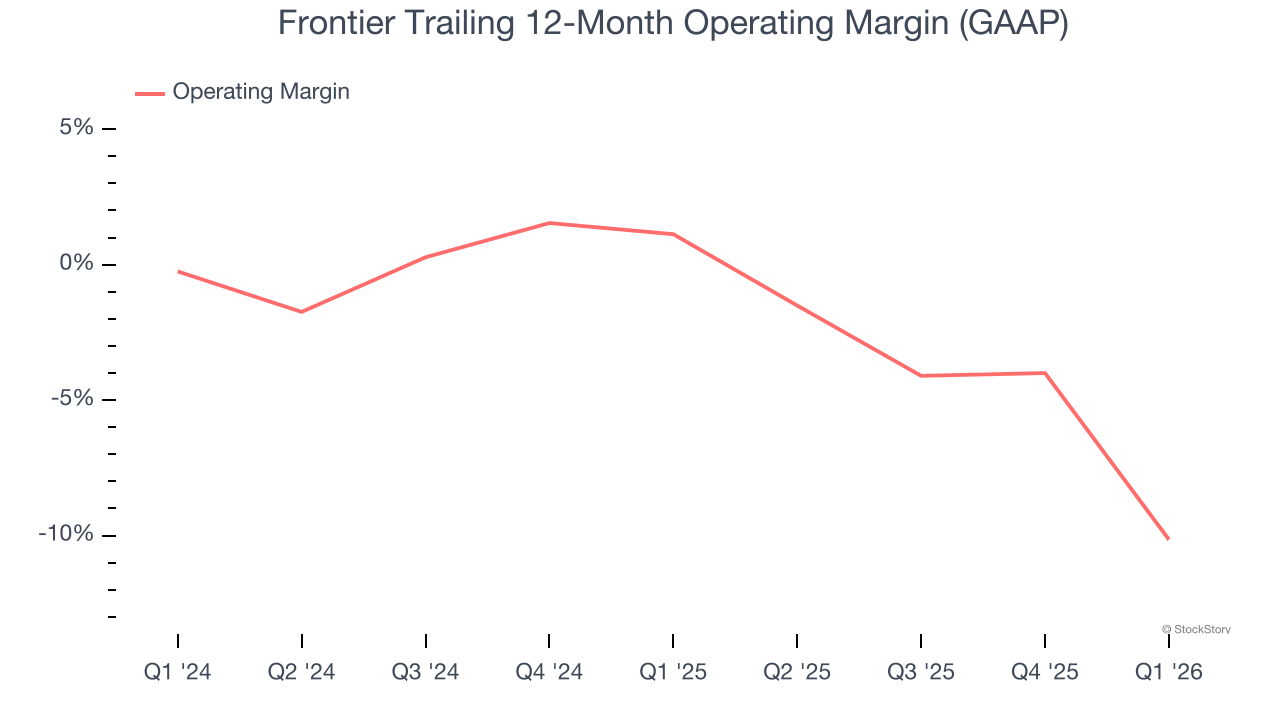
Frontier’s operating margin was negative 28.5% this quarter. The company's consistent lack of profits raise a flag.
Earnings Per Share
We track the long-term change in earnings per share (EPS) for the same reason as long-term revenue growth. Compared to revenue, however, EPS highlights whether a company’s growth is profitable.
Although Frontier’s full-year earnings are still negative, it reduced its losses and improved its EPS by 9.8% annually over the last four years. The next few quarters will be critical for assessing its long-term profitability.
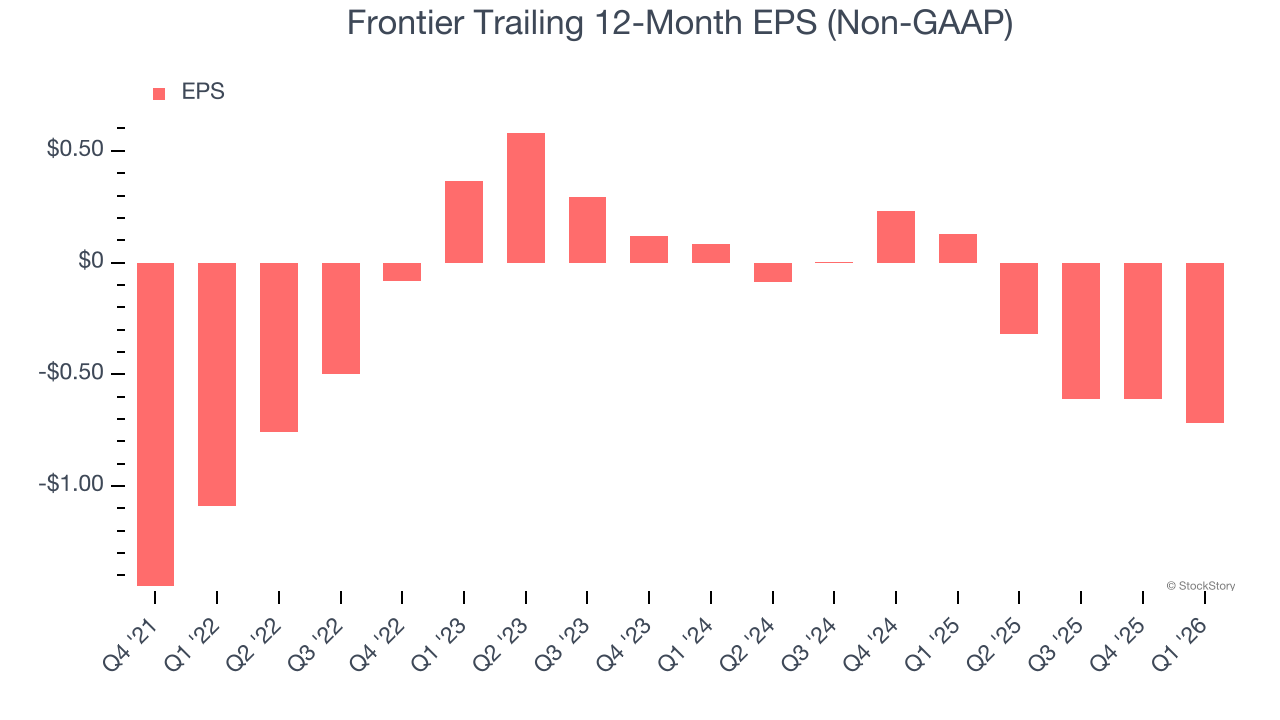
In Q1, Frontier reported adjusted EPS of negative $0.30, down from negative $0.19 in the same quarter last year. Despite falling year on year, this print easily cleared analysts’ estimates. We also like to analyze expected EPS growth based on Wall Street analysts’ consensus projections, but there is insufficient data.
Key Takeaways from Frontier’s Q1 Results
We were impressed by Frontier’s optimistic EPS guidance for next quarter, which blew past analysts’ expectations. We were also glad its EBITDA outperformed Wall Street’s estimates. On the other hand, its revenue missed and its adjusted operating income fell short of Wall Street’s estimates. Zooming out, we think this was a mixed quarter. The market seemed to be hoping for more, and the stock traded down 3.9% to $3.95 immediately after reporting.
Is Frontier an attractive investment opportunity at the current price? If you’re making that decision, you should consider the bigger picture of valuation, business qualities, as well as the latest earnings. We cover that in our actionable full research report which you can read here (it’s free).