

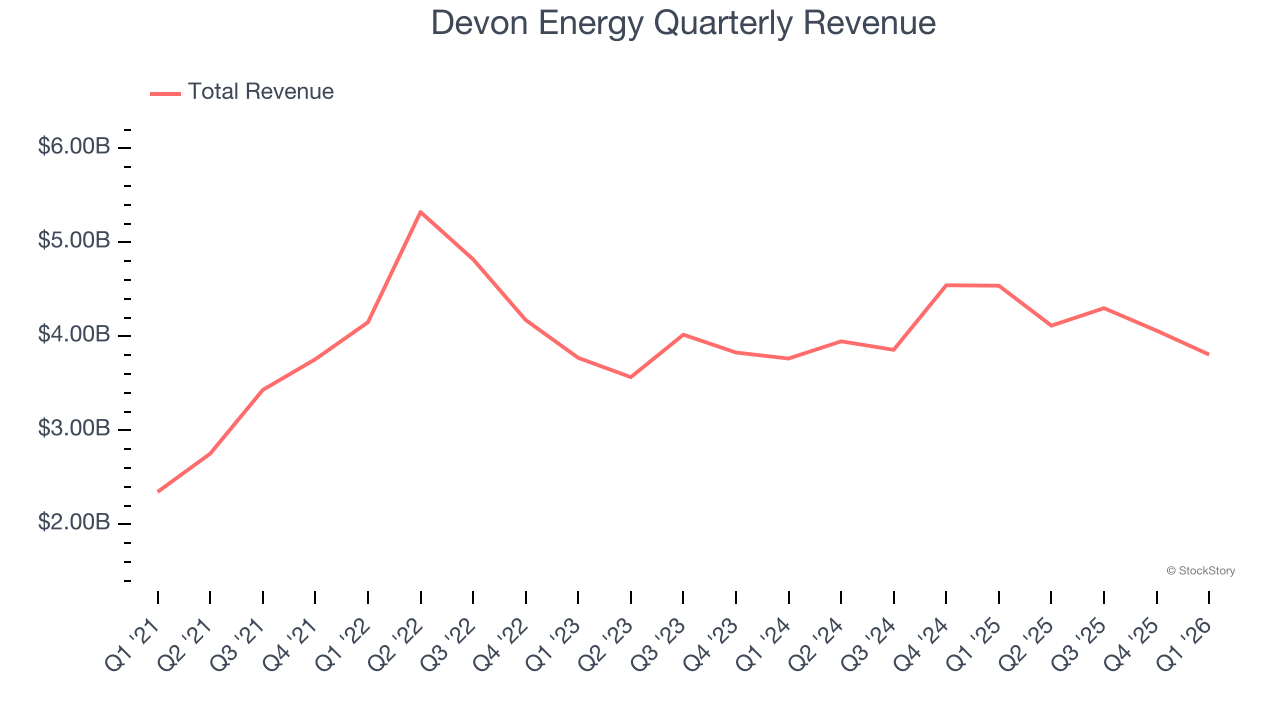
Oil and gas producer Devon Energy (NYSE:DVN) missed Wall Street’s revenue expectations in Q1 CY2026, with sales falling 16.1% year on year to $3.81 billion. Its GAAP profit of $0.19 per share was 82.1% below analysts’ consensus estimates.
Is now the time to buy Devon Energy? Find out by accessing our full research report, it’s free.
Devon Energy (DVN) Q1 CY2026 Highlights:
- Revenue: $3.81 billion vs analyst estimates of $3.89 billion (16.1% year-on-year decline, 2% miss)
- EPS (GAAP): $0.19 vs analyst expectations of $1.06 (82.1% miss)
- Free Cash Flow Margin: 21.4%, similar to the same quarter last year
- Oil production per day: up 2.2% year on year
- Market Capitalization: $31.69 billion
Company Overview
With operations spanning from the oil-rich Delaware Basin to the Bakken formation of North Dakota, Devon Energy (NYSE:DVN) explores for and produces oil, natural gas, and natural gas liquids from wells drilled across the United States.
Revenue Growth
A company’s long-term performance can give signals about its business quality. Even a bad business, especially in a cyclical industry, can shine for a year or so, but a top-tier one should exhibit resilience through cycles. Over the last five years, Devon Energy grew its sales at an exceptional 22.7% compounded annual growth rate. Its growth surpassed the average energy upstream and integrated energy company and shows its offerings resonate with customers, a great starting point for our analysis.
Even a long stretch in Energy can be shaped by a single commodity cycle, so extending the view to ten years adds another perspective and reveals which companies are built to grow regardless of the pricing regime. Devon Energy’s annualized revenue growth of 3.3% over the last ten years is below its five-year trend, but we still think the results suggest decent demand.
While looking at revenue is important, it can also introduce noise around commodity prices and M&A. Analyzing drivers of revenue, on the other hand, highlights what is happening inside the asset base and whether the economic footprint of a company is expanding. Over the last two years, Devon Energy’s oil production per day averaged 13.2% year-on-year growth while its natural gas production per day averaged 16.6% year-on-year growth. 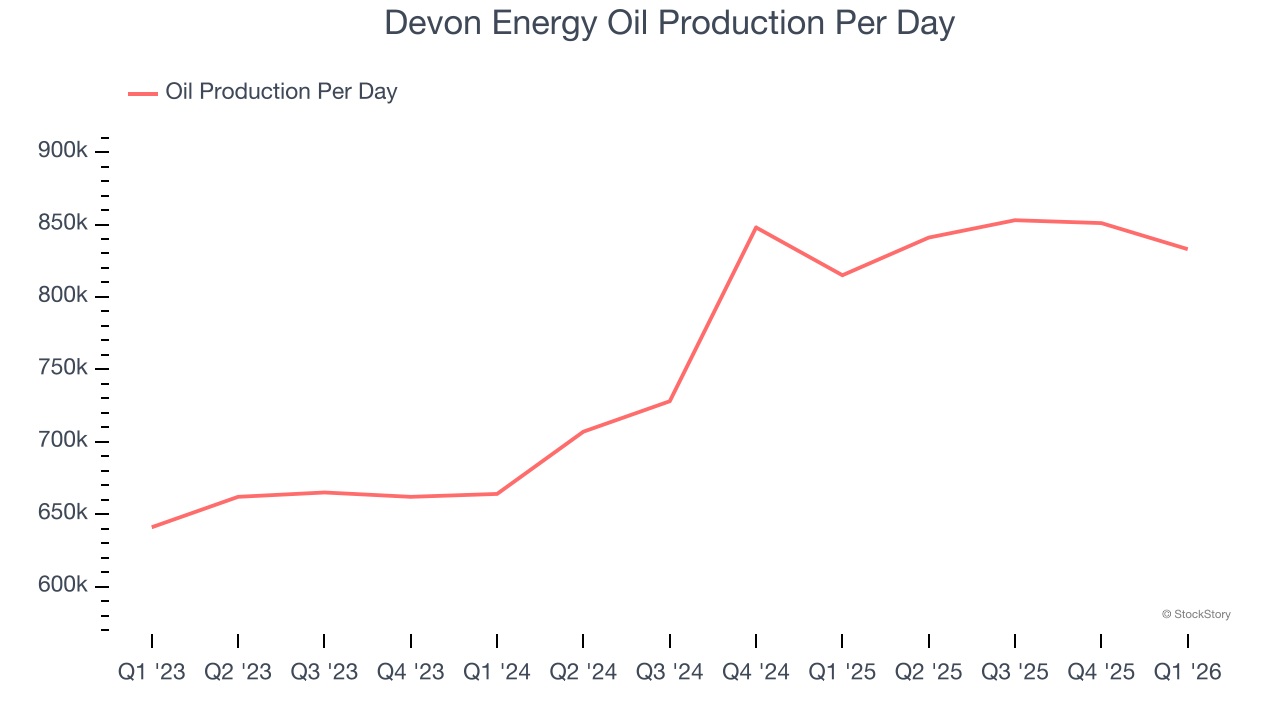
This quarter, Devon Energy missed Wall Street’s estimates and reported a rather uninspiring 16.1% year-on-year revenue decline, generating $3.81 billion of revenue. This quarter, Devon Energy reported modest year-on-year Oil production per day growth of 2.2%.
ALSO WORTH WATCHING: Nvidia’s Quiet Partner. Nvidia’s chips cost a hundred grand. The connectors that make them work cost even more. One company makes them all.
Every AI server needs specialized infrastructure the chip companies don’t make. High-speed cables. Power connectors. Thermal sensors. This 90-year-old company built a monopoly on it. The AI boom just started. This stock is still flying under the radar. Claim The Stock Ticker Here for FREE.
Adjusted EBITDA Margin
Adjusted EBITDA margin captures the true operating profitability of an energy producer by removing accounting noise around depletion and capitalized drilling costs. It reveals how much cash the asset base generates before capital structure and reinvestment requirements shape reported earnings.
Devon Energy has been an efficient company over the last five years. It was one of the more profitable businesses in the energy upstream and integrated energy sector, boasting an average EBITDA margin of 47.6%.
Analyzing the trend in its profitability, Devon Energy’s EBITDA margin decreased by 3.3 percentage points over the last year. This raises questions about the company’s expense base because its revenue growth should have given it leverage on its fixed costs, resulting in better economies of scale and profitability.
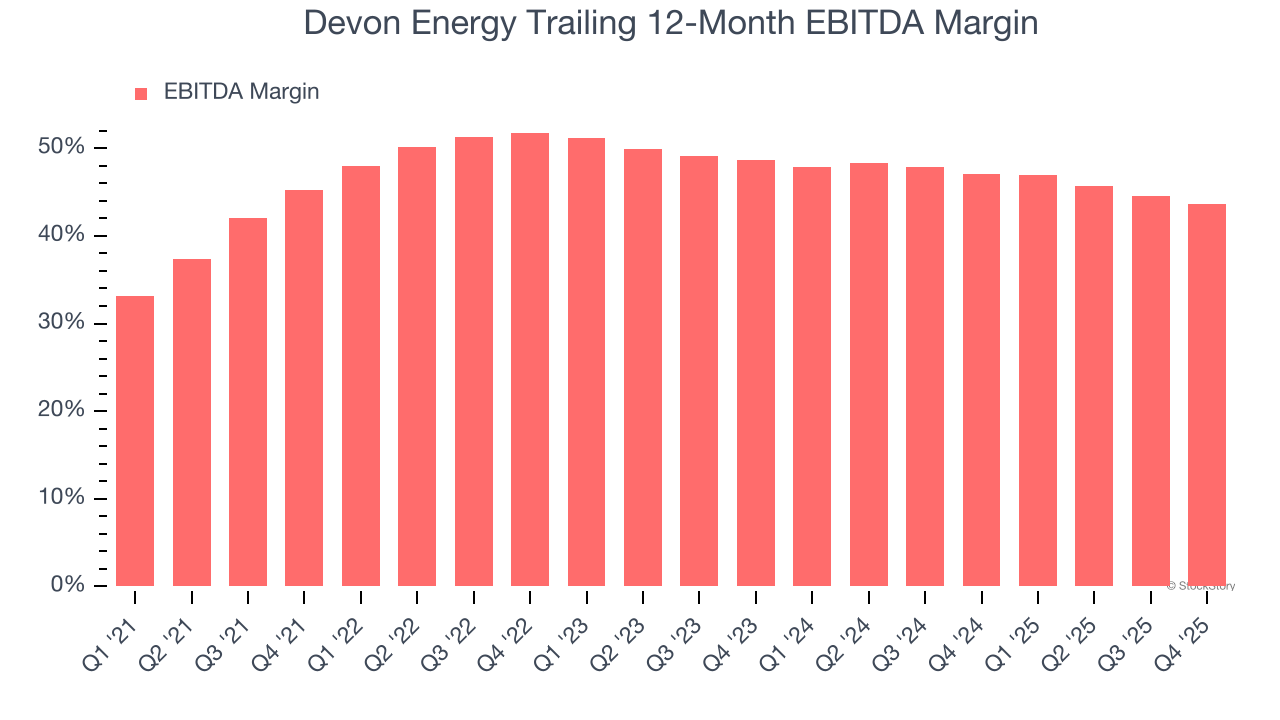
in line with the same quarter last year. This indicates the company’s overall cost structure has been relatively stable.
Cash Is King
Adjusted EBITDA shows how profitable a company’s existing “rock” is before financing and reinvestment, while free cash flow shows how much value remains after paying to replace those wells. Because production declines over time, strong EBITDA can coexist with weak FCF if drilling is expensive or declines are steep. FCF therefore captures both operating efficiency and the cost of sustaining production.
Devon Energy has shown terrific cash profitability, driven by its lucrative business model that enables it to reinvest, return capital to investors, and stay ahead of the competition. The company’s free cash flow margin was among the best in the energy upstream and integrated energy sector, averaging 22.8% over the last five years.
Absolute FCF margin levels matter but so does stability of free cash flow. All else equal, we’d prefer a 25.0% average free cash flow margin that is quite steady no matter how commodity prices behave rather than extremely high margins when times are good and negative ones when they’re tough.
Devon Energy’s ratio of quarterly free cash flow volatility to WTI Crude price volatility over the past five years was 2.8 (lower is better), indicating unusually strong insulation from commodity swings. This stability supports superior capital access in downturns and positions Devon Energy to act as a consolidator when weaker peers are forced to retrench.
You may be asking why we wait until the free cash flow line to perform this stability analysis versus commodity prices. Why not compare revenue or EBITDA to WTI in the case of Devon Energy? Because what ultimately matters is not how much revenue or profit you earn when prices are high but how much cash you can generate when prices are low. Free cash flow is the superior metric because it includes everything from hedging prowess to growth and maintenance capex to management behavior during good times and bad.
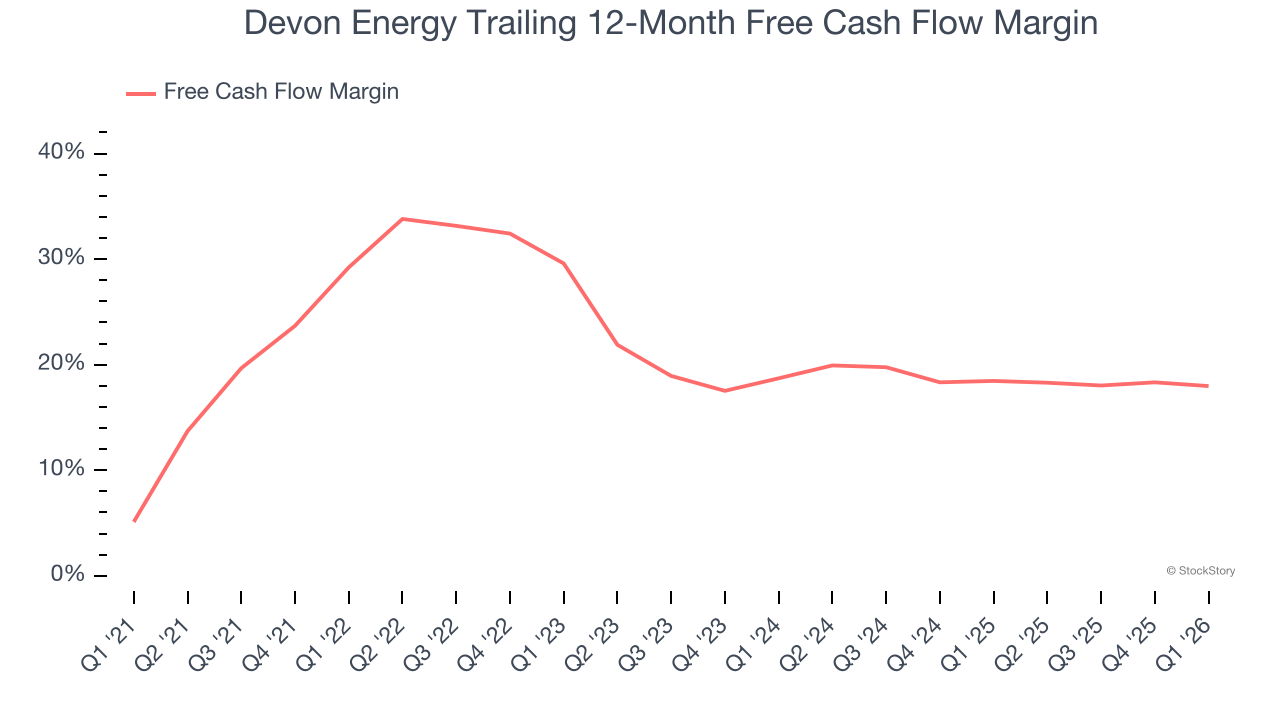
Devon Energy’s free cash flow clocked in at $816 million in Q1, equivalent to a 21.4% margin. This cash profitability was in line with the comparable period last year but below its five-year average. We wouldn’t read too much into it because investment needs can be seasonal, leading to short-term swings. Long-term trends carry greater meaning.
Key Takeaways from Devon Energy’s Q1 Results
We struggled to find many positives in these results. Its revenue missed and its EPS fell short of Wall Street’s estimates. Overall, this quarter could have been better. The stock traded down 1.8% to $50.27 immediately following the results.
Devon Energy’s earnings report left more to be desired. Let’s look forward to see if this quarter has created an opportunity to buy the stock. When making that decision, it’s important to consider its valuation, business qualities, as well as what has happened in the latest quarter. We cover that in our actionable full research report which you can read here (it’s free).