

Oil and gas producer Chord Energy (NASDAQ:CHRD) reported Q1 CY2026 results topping the market’s revenue expectations, with sales up 37.1% year on year to $1.67 billion. Its non-GAAP profit of $4.56 per share was 30.8% above analysts’ consensus estimates.
Is now the time to buy Chord Energy? Find out by accessing our full research report, it’s free.
Chord Energy (CHRD) Q1 CY2026 Highlights:
- Revenue: $1.67 billion vs analyst estimates of $1.25 billion (37.1% year-on-year growth, 33.1% beat)
- Adjusted EPS: $4.56 vs analyst estimates of $3.49 (30.8% beat)
- Adjusted EBITDA: $725.5 million vs analyst estimates of $674.2 million (43.6% margin, 7.6% beat)
- Operating Margin: 20%, down from 27.8% in the same quarter last year
- Free Cash Flow Margin: 9.4%, down from 28.6% in the same quarter last year
- Oil production per day: up 2.8% year on year
- Market Capitalization: $8.46 billion
Company Overview
Holding the largest acreage position in the Williston Basin, Chord Energy (NASDAQ:CHRD) drills for and produces crude oil, natural gas liquids, and natural gas in North Dakota's Williston Basin.
Revenue Growth
Cyclical industries such as Energy can make mediocre companies look great for a time, but a long-term view reveals which businesses can actually withstand and adapt to changing conditions. Over the last five years, Chord Energy grew its sales at an exceptional 23.3% compounded annual growth rate. Its growth surpassed the average energy upstream and integrated energy company and shows its offerings resonate with customers, a great starting point for our analysis.
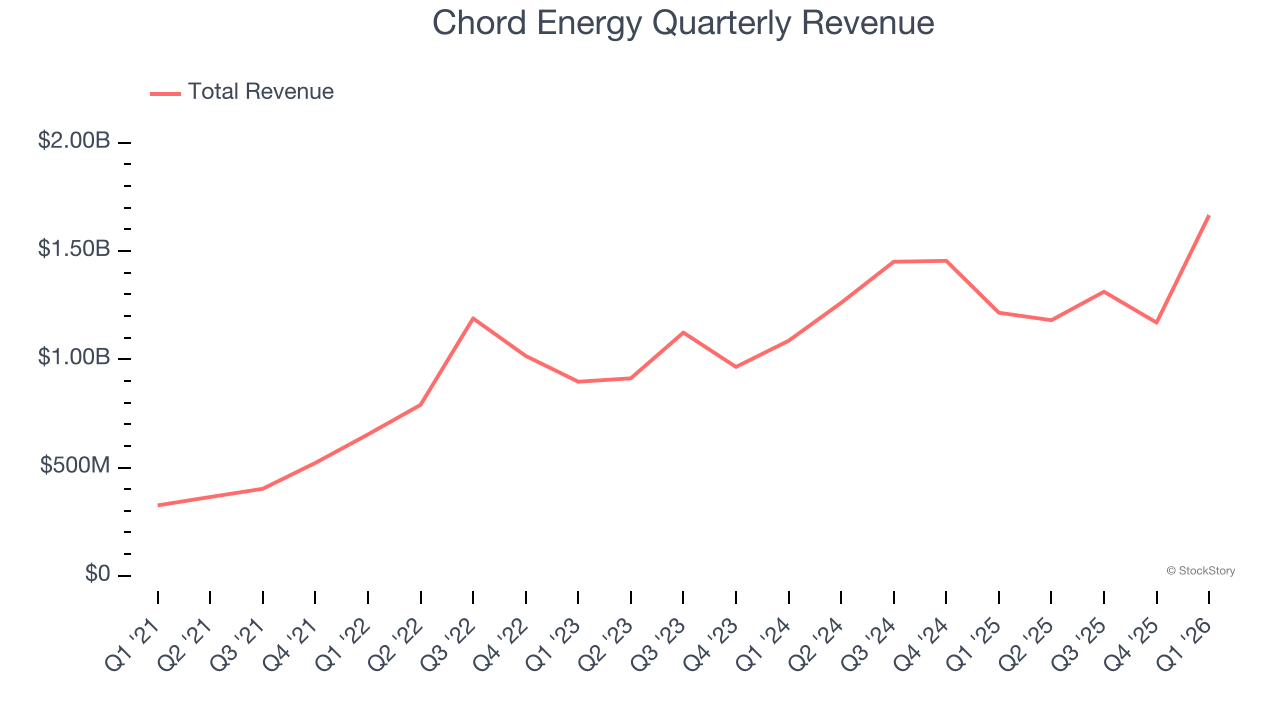
Energy cycles can be long enough that a single five-year period can still reflect one price environment, which is why an additional, decade-long view can help capture through-cycle performance. Chord Energy’s annualized revenue growth of 21.8% over the last ten years is below its five-year trend, but we still think the results suggest decent demand.
While looking at revenue is important, it can also introduce noise around commodity prices and M&A. Analyzing drivers of revenue, on the other hand, highlights what is happening inside the asset base and whether the economic footprint of a company is expanding. Over the last two years, Chord Energy’s oil production per day averaged 26.5% year-on-year growth while its ngl production per day averaged 21.9% year-on-year growth. 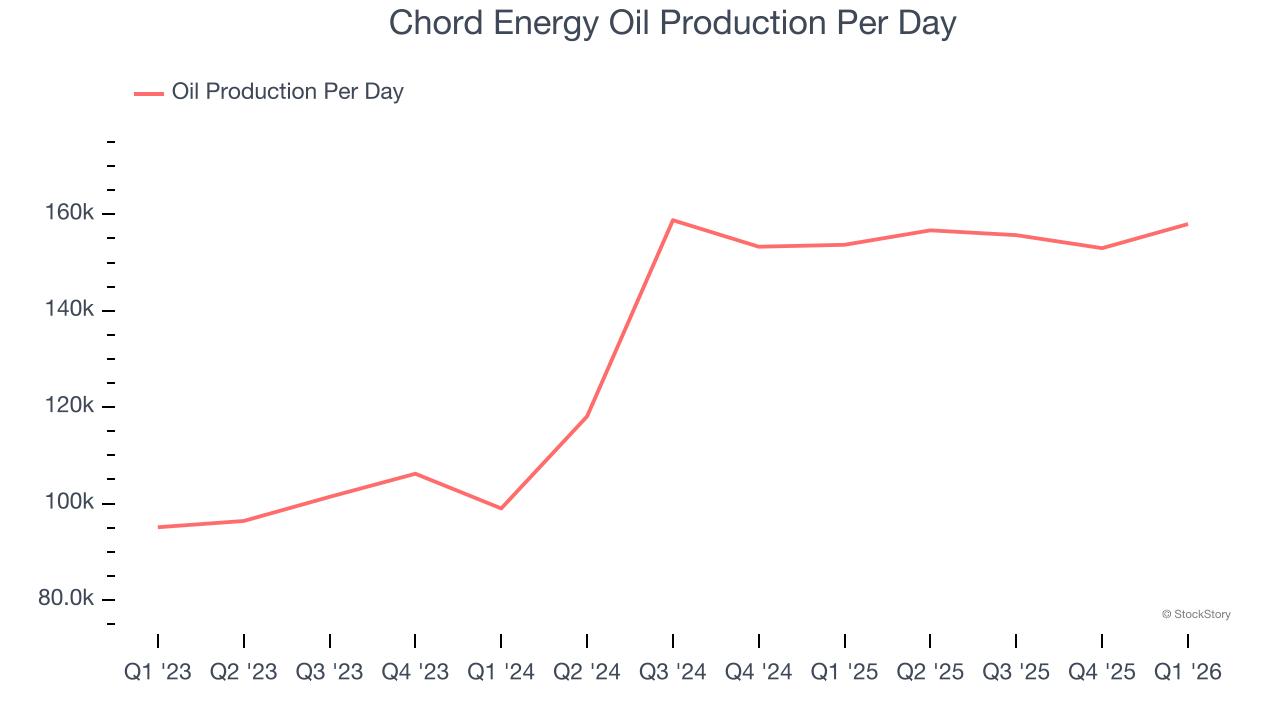
This quarter, Chord Energy reported wonderful year-on-year revenue growth of 37.1%, and its $1.67 billion of revenue exceeded Wall Street’s estimates by 33.1%. This quarter, Chord Energy reported modest year-on-year Oil production per day growth of 2.8%.
ONE MORE THING: 3 Hidden Platforms Growing 3X Faster than Amazon, Google, and PayPal. Amazon, Google, and Meta all followed the same playbook: Dominate an ignored market. Build an unbeatable moat. Scale until you’re unstoppable.
These three platforms are running that exact playbook right now. The early investors in Amazon made fortunes. The early investors in these could do the same. Get All 3 Stocks Here for FREE.
Adjusted EBITDA Margin
Chord Energy has been an efficient company over the last five years. It was one of the more profitable businesses in the energy upstream and integrated energy sector, boasting an average EBITDA margin of 44.8%.
Analyzing the trend in its profitability, Chord Energy’s EBITDA margin rose by 1.7 percentage points over the last year, as its sales growth gave it operating leverage.
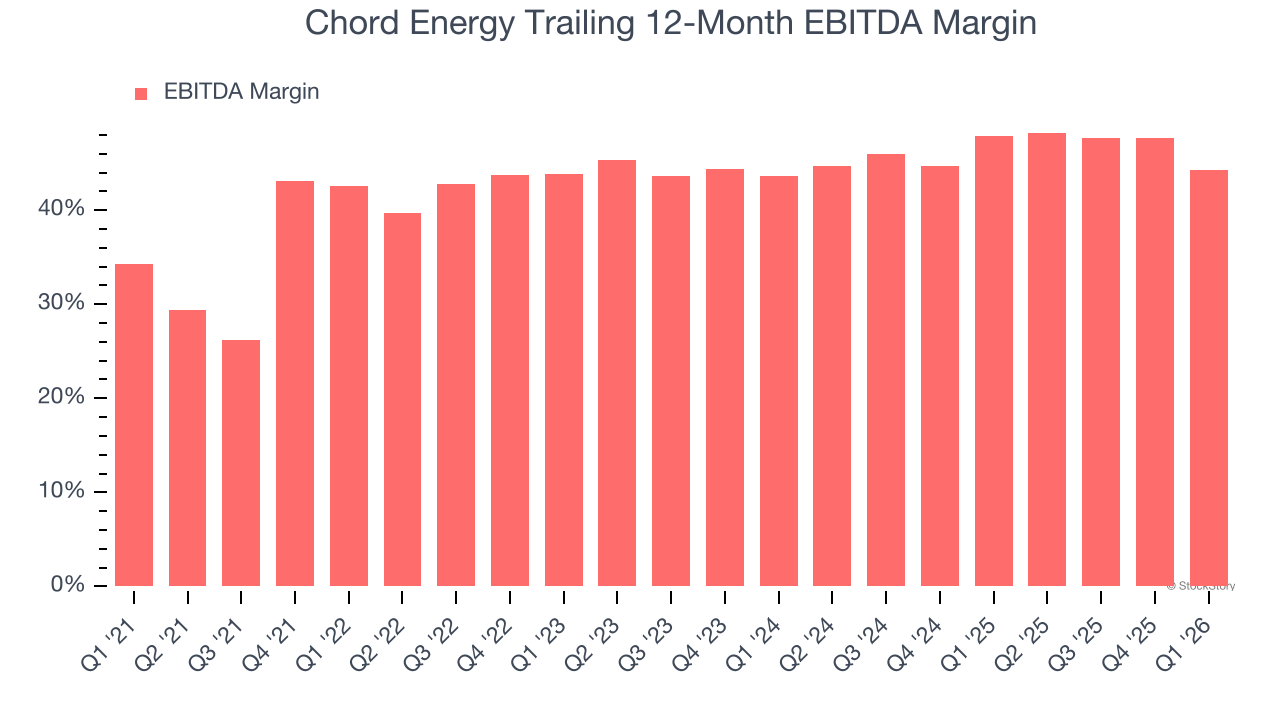
This quarter, Chord Energy generated an EBITDA margin profit margin of 43.6%, down 13.7 percentage points year on year. This contraction shows it was less efficient because its expenses grew faster than its revenue. This adjusted EBITDA beat Wall Street’s estimates by 7.6%.
Cash Is King
Adjusted EBITDA shows how profitable a company’s existing wells are before financing and reinvestment decisions, but free cash flow shows how much value remains after paying the cost of replacing those wells. In upstream energy, production naturally declines over time, so companies must continuously reinvest just to stand still. A producer can report strong EBITDA margins yet generate little or no free cash flow if its wells decline quickly or if new drilling is expensive. Free cash flow therefore captures not only how efficiently a company produces hydrocarbons today, but also how costly it is to sustain that production into the future.
Chord Energy has shown terrific cash profitability, driven by its lucrative business model that enables it to reinvest, return capital to investors, and stay ahead of the competition. The company’s free cash flow margin was among the best in the energy upstream and integrated energy sector, averaging 22.3% over the last five years.
While the level of free cash flow margins is important, their consistency matters just as much.
Chord Energy’s ratio of quarterly free cash flow volatility to WTI Crude price volatility over the past five years was 3.5 (lower is better), indicating unusually strong insulation from commodity swings. This stability supports superior capital access in downturns and positions Chord Energy to act as a consolidator when weaker peers are forced to retrench.
You may be asking why we wait until the free cash flow line to perform this stability analysis versus commodity prices. Why not compare revenue or EBITDA to WTI in the case of Chord Energy? Because what ultimately matters is not how much revenue or profit you earn when prices are high but how much cash you can generate when prices are low. Free cash flow is the superior metric because it includes everything from hedging prowess to growth and maintenance capex to management behavior during good times and bad.
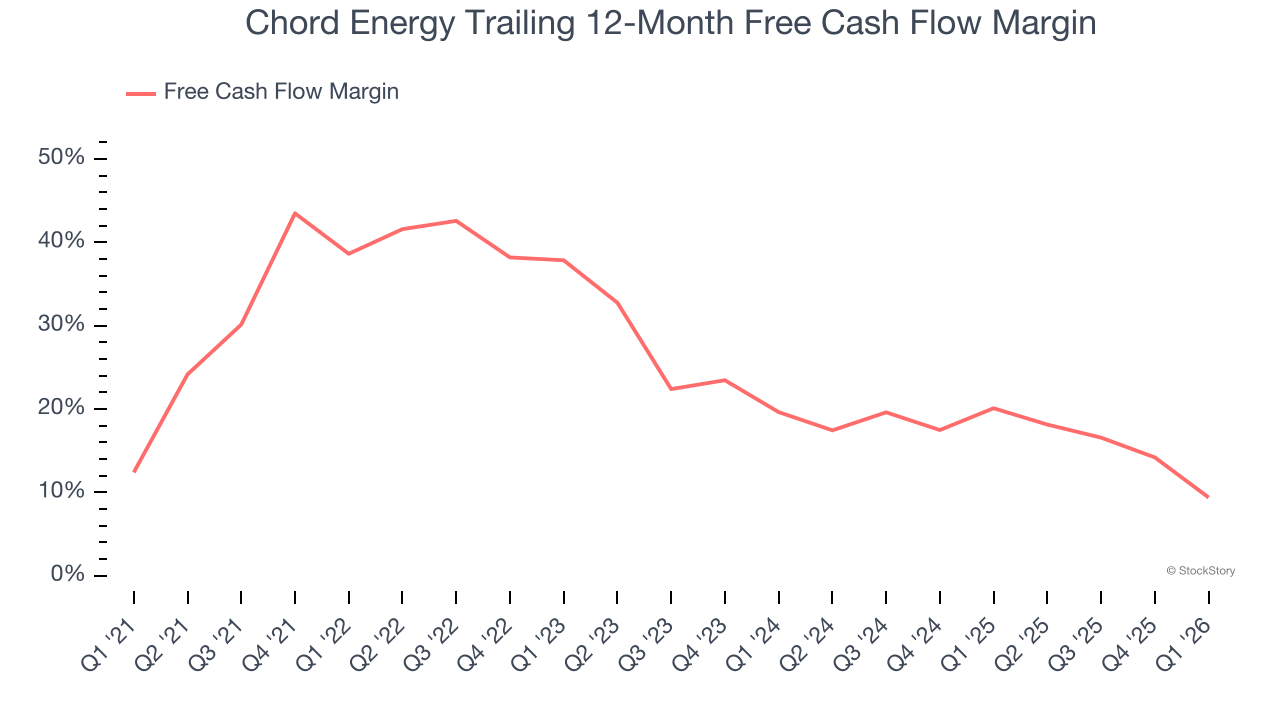
Chord Energy’s free cash flow clocked in at $156.2 million in Q1, equivalent to a 9.4% margin. The company’s cash profitability regressed as it was 19.3 percentage points lower than in the same quarter last year, which isn’t ideal considering its longer-term trend.
Key Takeaways from Chord Energy’s Q1 Results
It was good to see Chord Energy beat analysts’ EPS expectations this quarter. We were also excited its revenue outperformed Wall Street’s estimates by a wide margin. Zooming out, we think this was a solid print. The stock remained flat at $148.90 immediately after reporting.
Should you buy the stock or not? When making that decision, it’s important to consider its valuation, business qualities, as well as what has happened in the latest quarter. We cover that in our actionable full research report which you can read here (it’s free).