

Automotive technology company Visteon (NYSE:VC) beat Wall Street’s revenue expectations in Q1 CY2026, with sales up 2.1% year on year to $954 million. The company expects the full year’s revenue to be around $3.73 billion, close to analysts’ estimates. Its non-GAAP profit of $1.65 per share was 10.2% below analysts’ consensus estimates.
Is now the time to buy Visteon? Find out by accessing our full research report, it’s free.
Visteon (VC) Q1 CY2026 Highlights:
- Revenue: $954 million vs analyst estimates of $898.1 million (2.1% year-on-year growth, 6.2% beat)
- Adjusted EPS: $1.65 vs analyst expectations of $1.84 (10.2% miss)
- Adjusted EBITDA: $104 million vs analyst estimates of $105.3 million (10.9% margin, 1.2% miss)
- The company reconfirmed its revenue guidance for the full year of $3.73 billion at the midpoint
- EBITDA guidance for the full year is $475 million at the midpoint, in line with analyst expectations
- Operating Margin: 6.2%, down from 9.7% in the same quarter last year
- Free Cash Flow was -$30 million, down from $38 million in the same quarter last year
- Market Capitalization: $2.68 billion
"Our first quarter results reflect strong continued execution across our strategic priorities in a dynamic supply chain environment," said President and CEO Sachin Lawande.
Company Overview
Originally spun off from Ford Motor Company in 2000, Visteon (NYSE:VC) designs and manufactures cockpit electronics for vehicles, including digital instrument clusters, displays, infotainment systems, and battery management systems.
Revenue Growth
A company’s long-term sales performance can indicate its overall quality. Any business can experience short-term success, but top-performing ones enjoy sustained growth for years. Regrettably, Visteon’s sales grew at a mediocre 7.4% compounded annual growth rate over the last five years. This fell short of our benchmark for the industrials sector and is a rough starting point for our analysis.
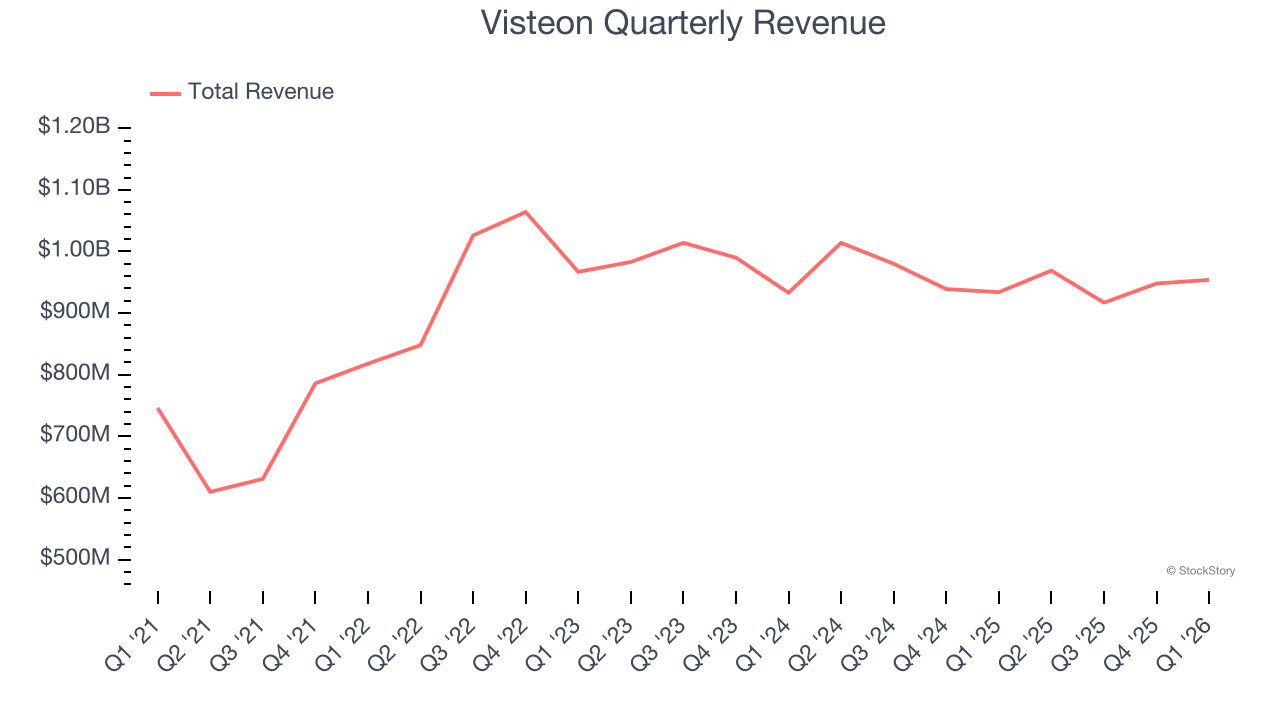
Long-term growth is the most important, but within industrials, a half-decade historical view may miss new industry trends or demand cycles. Visteon’s performance shows it grew in the past but relinquished its gains over the last two years, as its revenue fell by 1.7% annually. 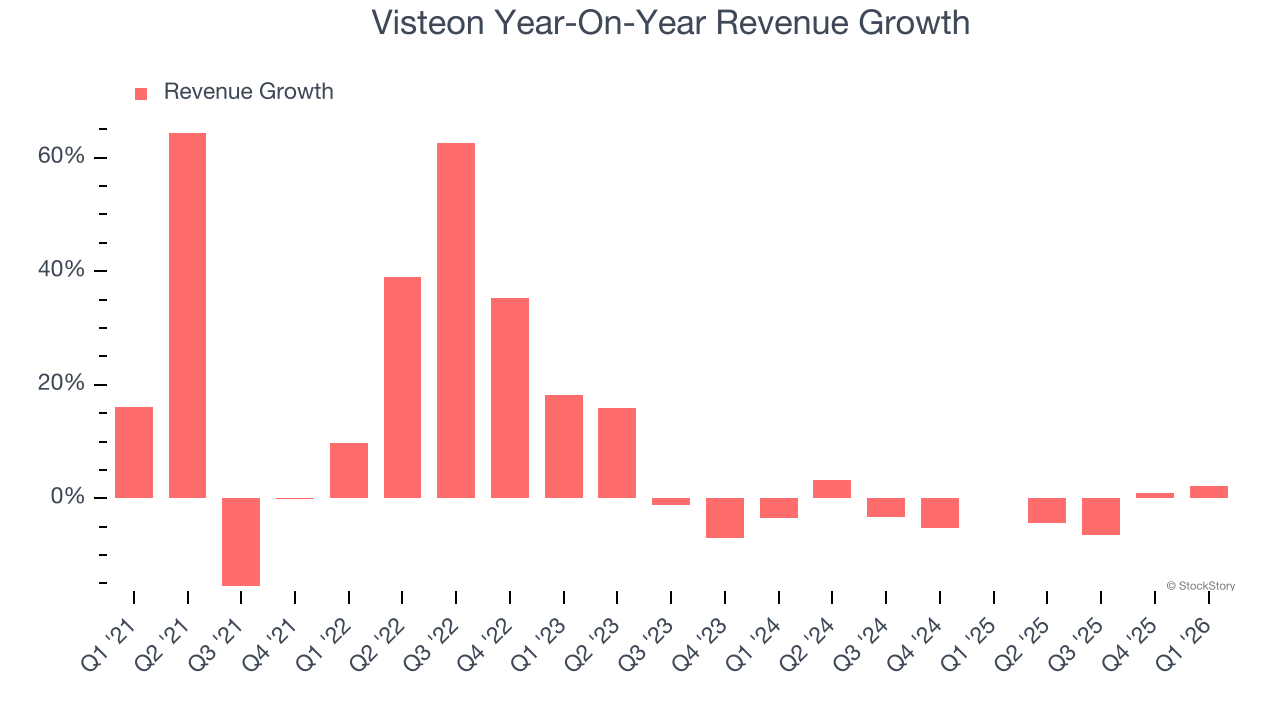
This quarter, Visteon reported modest year-on-year revenue growth of 2.1% but beat Wall Street’s estimates by 6.2%.
Looking ahead, sell-side analysts expect revenue to remain flat over the next 12 months. While this projection suggests its newer products and services will spur better top-line performance, it is still below the sector average.
ONE MORE THING: The $21 AI Application Stock Wall Street Forgot. While Wall Street obsesses over who’s building AI, one company is already using it to print money. And nobody’s paying attention.
AI chip stocks trade at ridiculous valuations. This company processes a trillion consumer signals monthly using AI and trades at a third of the price. The gap won’t last. The institutions will figure it out. You need to see this first. Read the FREE Report Before They Notice.
Operating Margin
Visteon was profitable over the last five years but held back by its large cost base. Its average operating margin of 6.3% was weak for an industrials business. This result isn’t too surprising given its low gross margin as a starting point.
On the plus side, Visteon’s operating margin rose by 5.5 percentage points over the last five years, as its sales growth gave it operating leverage.
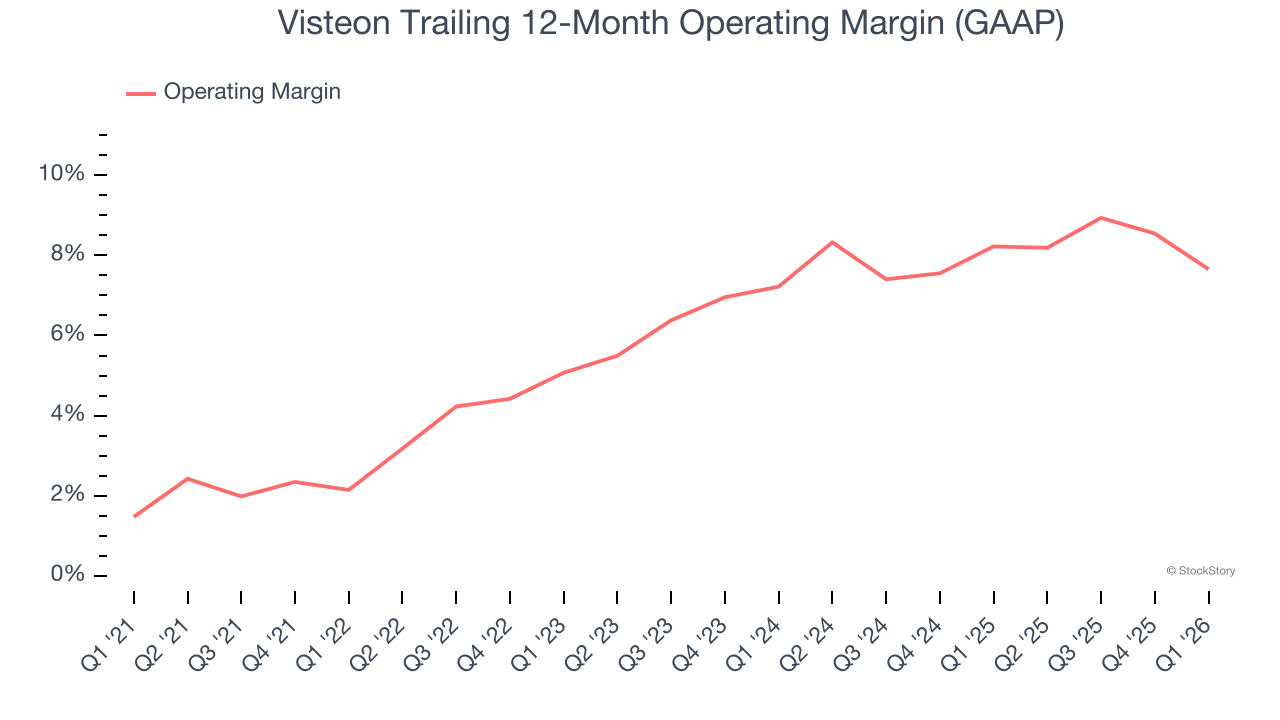
This quarter, Visteon generated an operating margin profit margin of 6.2%, down 3.6 percentage points year on year. Since Visteon’s operating margin decreased more than its gross margin, we can assume it was less efficient because expenses such as marketing, R&D, and administrative overhead increased.
Earnings Per Share
We track the long-term change in earnings per share (EPS) for the same reason as long-term revenue growth. Compared to revenue, however, EPS highlights whether a company’s growth is profitable.
Visteon’s EPS grew at 42.8% compounded annual growth rate over the last five years, higher than its 7.4% annualized revenue growth. This tells us the company became more profitable on a per-share basis as it expanded.
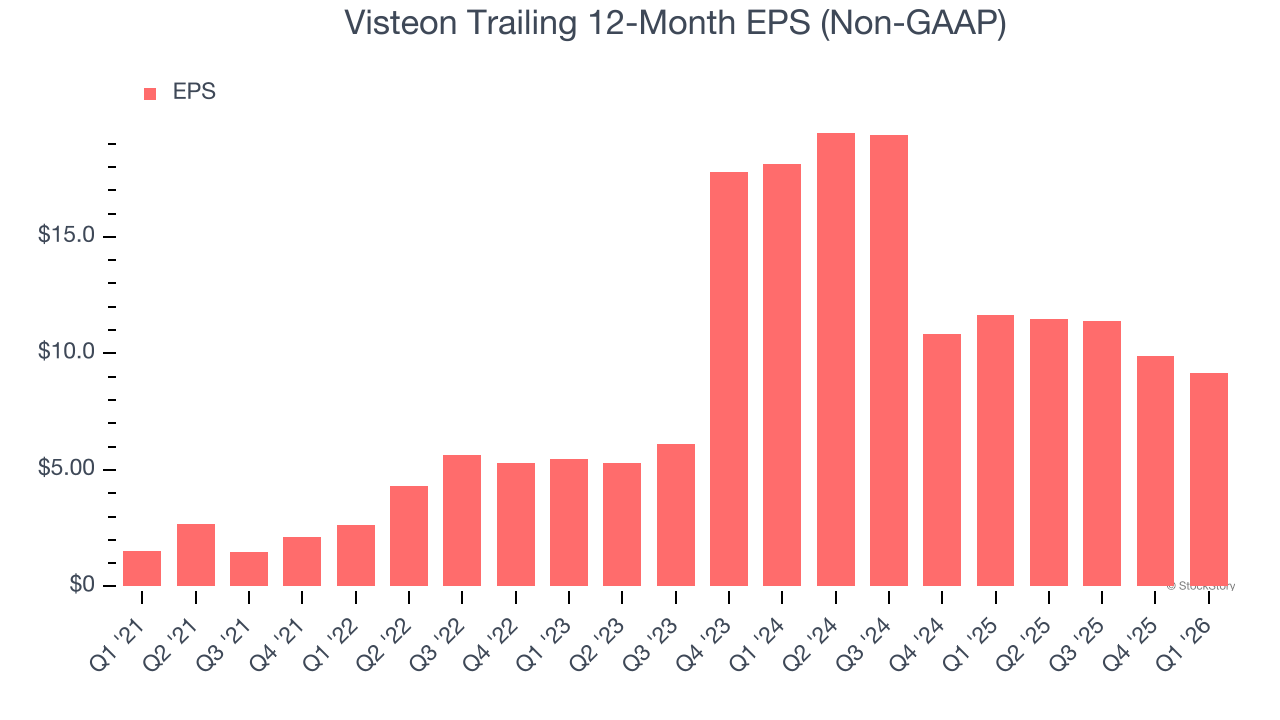
Diving into Visteon’s quality of earnings can give us a better understanding of its performance. As we mentioned earlier, Visteon’s operating margin declined this quarter but expanded by 5.5 percentage points over the last five years. Its share count also shrank by 3.9%, and these factors together are positive signs for shareholders because improving profitability and share buybacks turbocharge EPS growth relative to revenue growth. 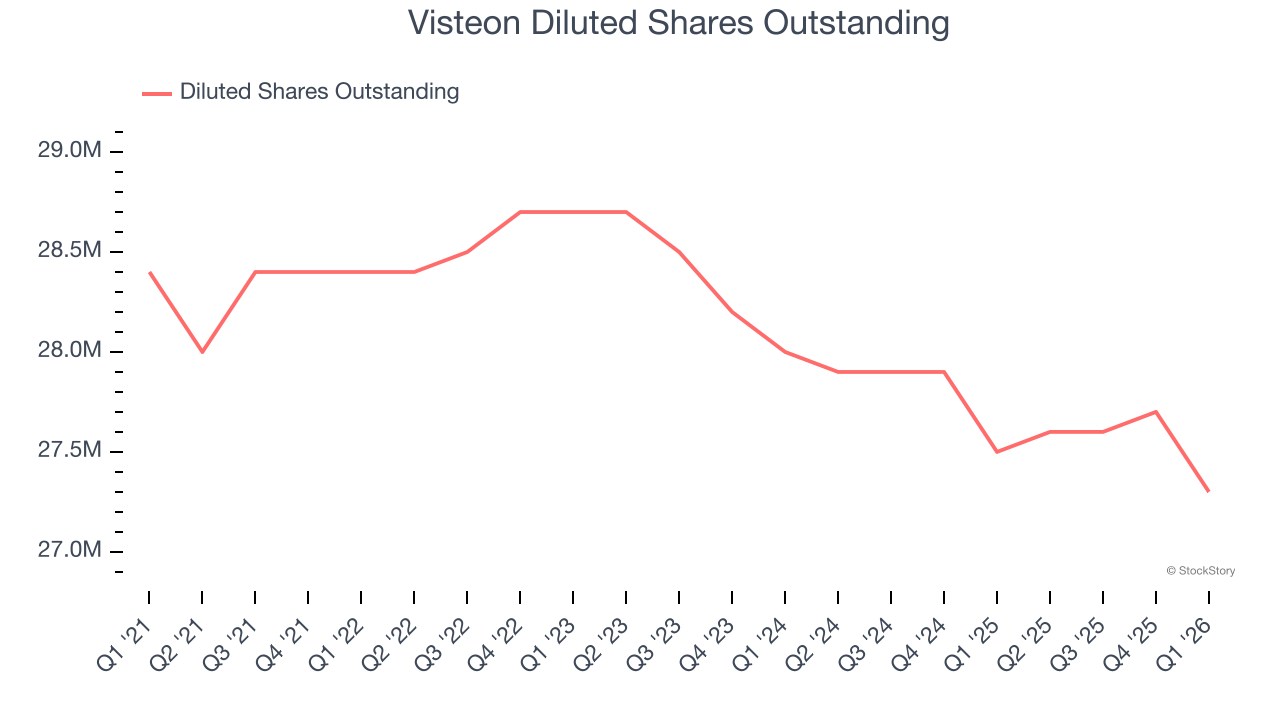
Like with revenue, we analyze EPS over a more recent period because it can provide insight into an emerging theme or development for the business.
For Visteon, its two-year annual EPS declines of 28.9% mark a reversal from its (seemingly) healthy five-year trend. We hope Visteon can return to earnings growth in the future.
In Q1, Visteon reported adjusted EPS of $1.65, down from $2.40 in the same quarter last year. This print missed analysts’ estimates, but we care more about long-term adjusted EPS growth than short-term movements. Over the next 12 months, Wall Street expects Visteon’s full-year EPS of $9.15 to shrink by 2.4%.
Key Takeaways from Visteon’s Q1 Results
We were impressed by how significantly Visteon blew past analysts’ revenue expectations this quarter. On the other hand, its EPS missed and its EBITDA fell slightly short of Wall Street’s estimates. Zooming out, we think this was a weaker quarter despite a topline beat. Investors were likely hoping for more, and shares traded down 5% to $95.03 immediately following the results.
So should you invest in Visteon right now? If you’re making that decision, you should consider the bigger picture of valuation, business qualities, as well as the latest earnings. We cover that in our actionable full research report which you can read here (it’s free).