

Industrial conglomerate Honeywell (NASDAQ:HON) missed Wall Street’s revenue expectations in Q1 CY2026 as sales rose 2.4% year on year to $9.14 billion. The company’s full-year revenue guidance of $39.3 billion at the midpoint came in 0.5% below analysts’ estimates. Its non-GAAP profit of $2.45 per share was 5.6% above analysts’ consensus estimates.
Is now the time to buy Honeywell? Find out by accessing our full research report, it’s free.
Honeywell (HON) Q1 CY2026 Highlights:
- Revenue: $9.14 billion vs analyst estimates of $9.28 billion (2.4% year-on-year growth, 1.4% miss)
- Adjusted EPS: $2.45 vs analyst estimates of $2.32 (5.6% beat)
- Adjusted Operating Income: $1.53 billion vs analyst estimates of $2.11 billion (16.7% margin, 27.6% miss)
- The company reconfirmed its revenue guidance for the full year of $39.3 billion at the midpoint
- Management reiterated its full-year Adjusted EPS guidance of $10.50 at the midpoint
- Operating Margin: 16.1%, down from 21.5% in the same quarter last year
- Free Cash Flow was -$873 million, down from $346 million in the same quarter last year
- Organic Revenue rose 2% year on year (miss)
- Market Capitalization: $139.4 billion
Company Overview
Originally founded in 1906 as a thermostat company, Honeywell (NASDAQ:HON) is a multinational conglomerate known for its aerospace systems, building technologies, performance materials, and safety and productivity solutions.
Revenue Growth
Examining a company’s long-term performance can provide clues about its quality. Any business can have short-term success, but a top-tier one grows for years. Regrettably, Honeywell’s sales grew at a sluggish 3.1% compounded annual growth rate over the last five years. This was below our standard for the industrials sector and is a poor baseline for our analysis.
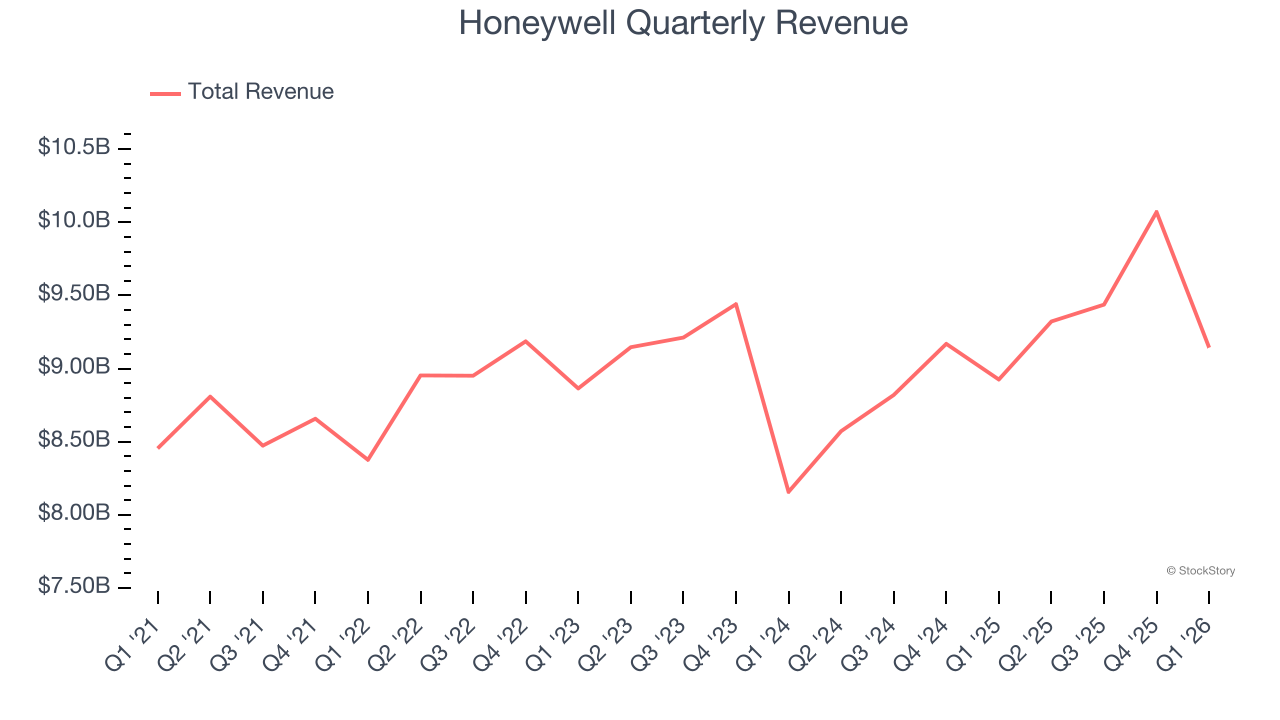
Long-term growth is the most important, but within industrials, a half-decade historical view may miss new industry trends or demand cycles. Honeywell’s annualized revenue growth of 2.8% over the last two years aligns with its five-year trend, suggesting its demand was consistently weak. 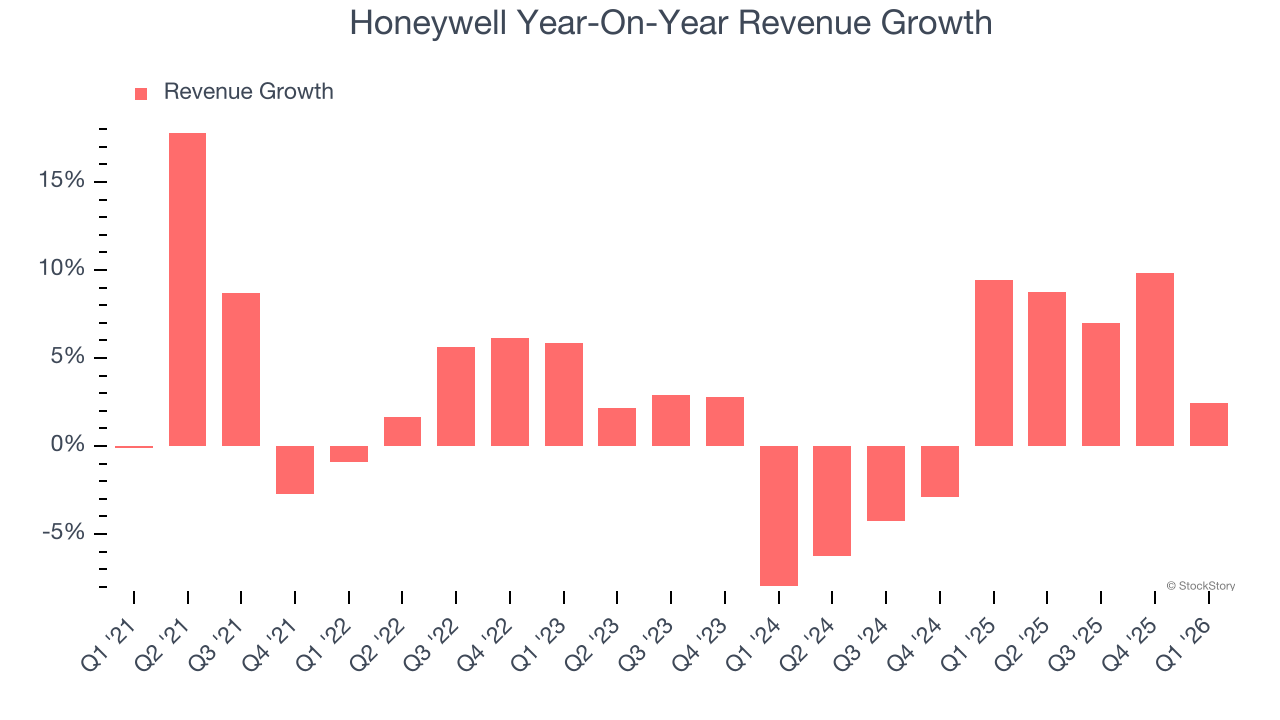
We can better understand the company’s sales dynamics by analyzing its organic revenue, which strips out one-time events like acquisitions and currency fluctuations that don’t accurately reflect its fundamentals. Over the last two years, Honeywell’s organic revenue averaged 4.6% year-on-year growth. Because this number is better than its two-year revenue growth, we can see that some mixture of divestitures and foreign exchange rates dampened its headline results. 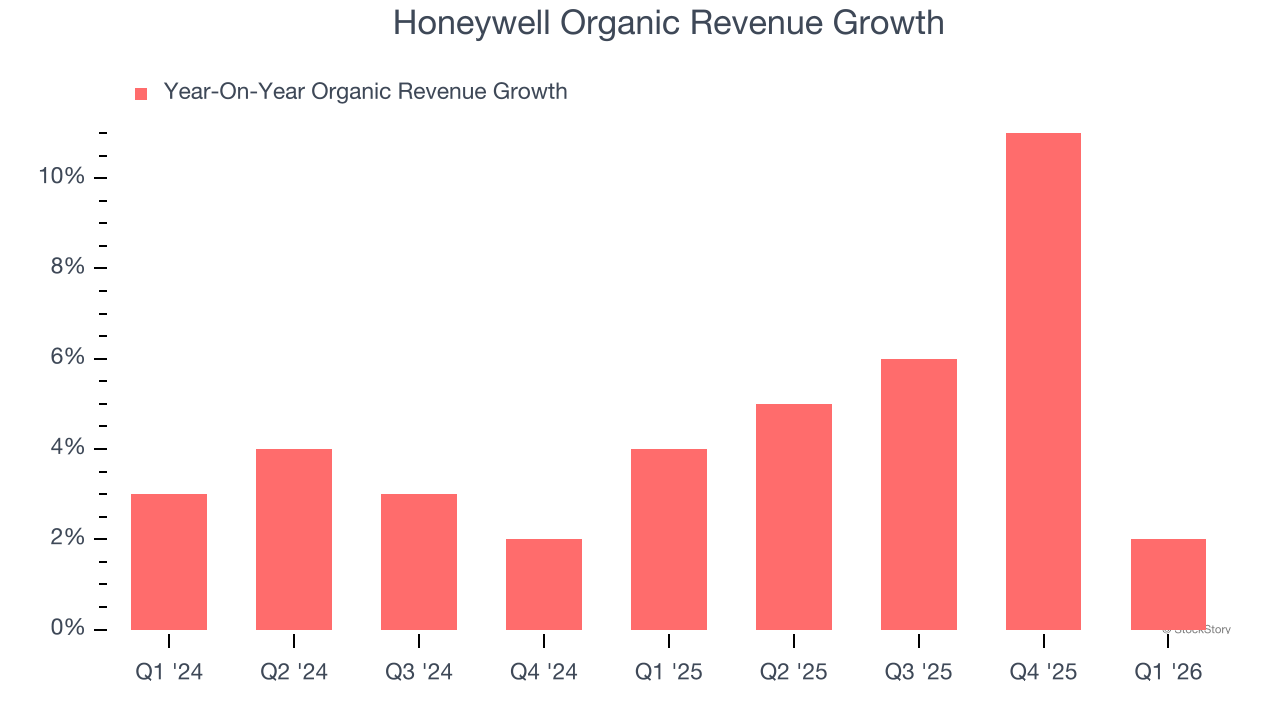
This quarter, Honeywell’s revenue grew by 2.4% year on year to $9.14 billion, falling short of Wall Street’s estimates.
Looking ahead, sell-side analysts expect revenue to grow 5.6% over the next 12 months. While this projection indicates its newer products and services will fuel better top-line performance, it is still below the sector average.
ONE MORE THING: The $21 AI Application Stock Wall Street Forgot. While Wall Street obsesses over who’s building AI, one company is already using it to print money. And nobody’s paying attention.
AI chip stocks trade at ridiculous valuations. This company processes a trillion consumer signals monthly using AI and trades at a third of the price. The gap won’t last. The institutions will figure it out. You need to see this first. Read the FREE Report Before They Notice.
Operating Margin
Honeywell has been a well-oiled machine over the last five years. It demonstrated elite profitability for an industrials business, boasting an average operating margin of 20.2%. This result isn’t too surprising as its gross margin gives it a favorable starting point.
Analyzing the trend in its profitability, Honeywell’s operating margin decreased by 3.4 percentage points over the last five years. This raises questions about the company’s expense base because its revenue growth should have given it leverage on its fixed costs, resulting in better economies of scale and profitability.
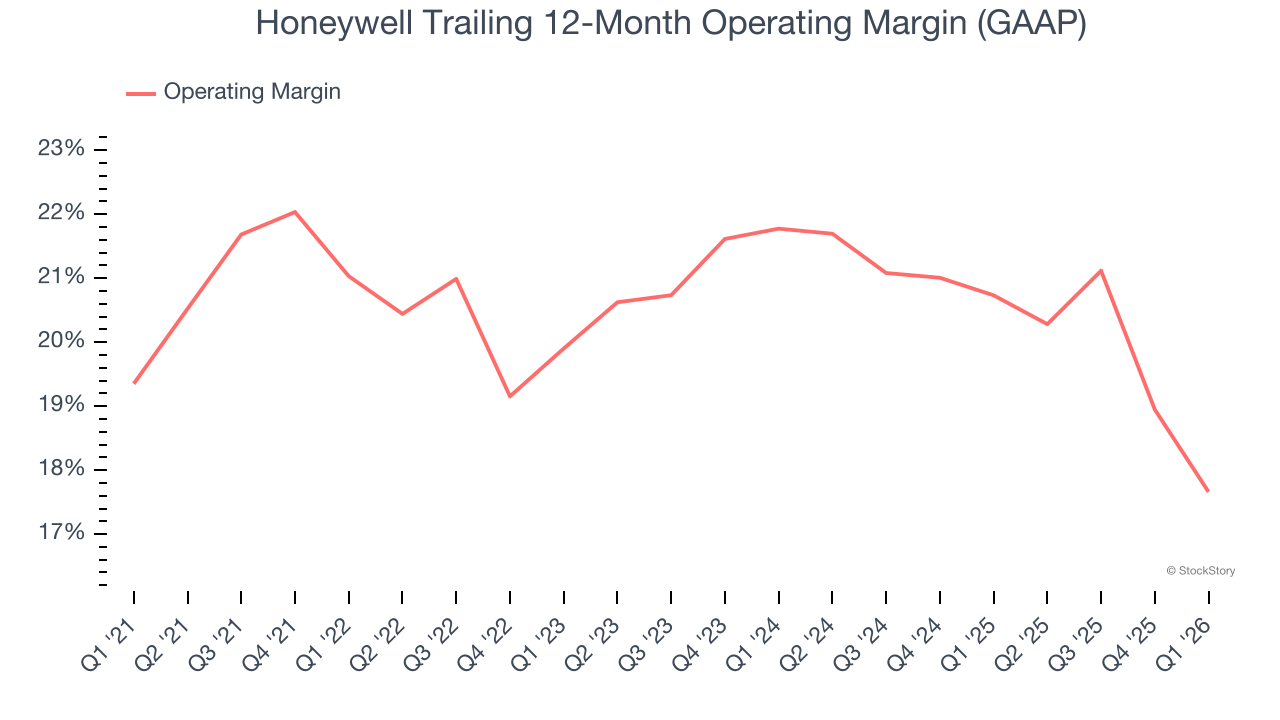
This quarter, Honeywell generated an operating margin profit margin of 16.1%, down 5.4 percentage points year on year. Conversely, its revenue and gross margin actually rose, so we can assume it was less efficient because its operating expenses like marketing, R&D, and administrative overhead grew faster than its revenue.
Earnings Per Share
Revenue trends explain a company’s historical growth, but the long-term change in earnings per share (EPS) points to the profitability of that growth – for example, a company could inflate its sales through excessive spending on advertising and promotions.
Honeywell’s EPS grew at 9.3% compounded annual growth rate over the last five years, higher than its 3.1% annualized revenue growth. However, this alone doesn’t tell us much about its business quality because its operating margin didn’t improve.
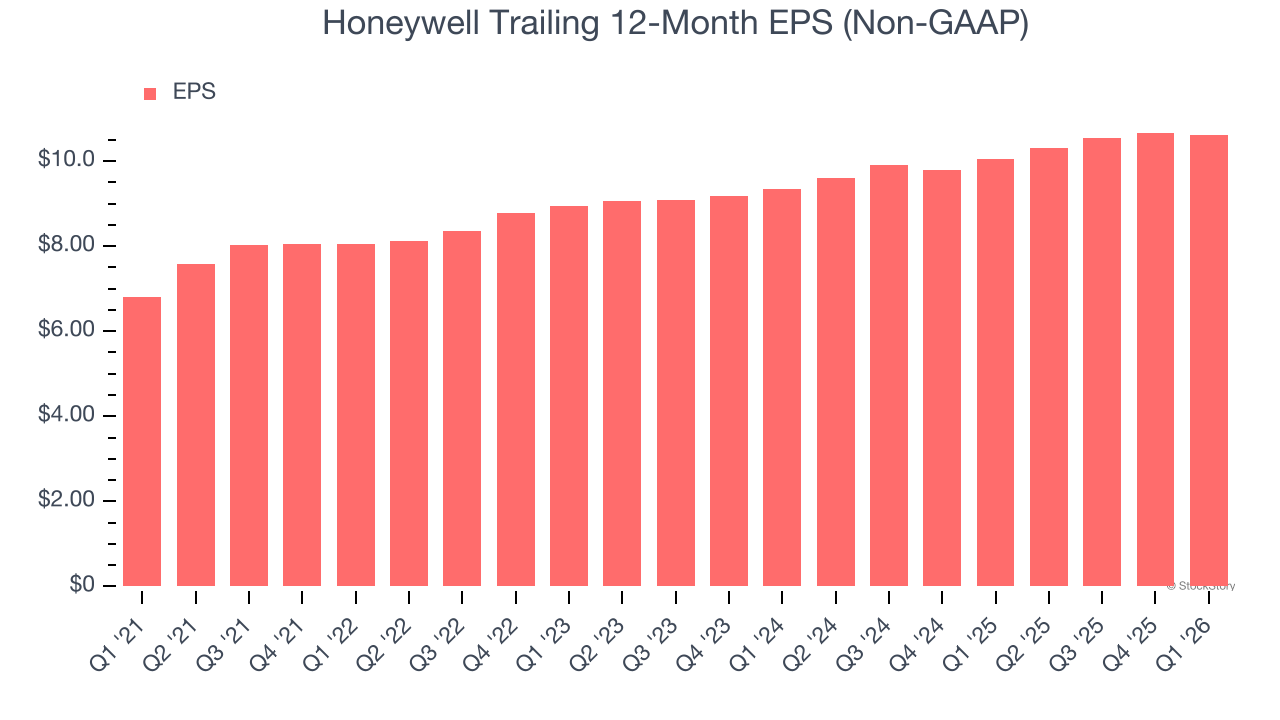
We can take a deeper look into Honeywell’s earnings to better understand the drivers of its performance. A five-year view shows that Honeywell has repurchased its stock, shrinking its share count by 9.4%. This tells us its EPS outperformed its revenue not because of increased operational efficiency but financial engineering, as buybacks boost per share earnings. 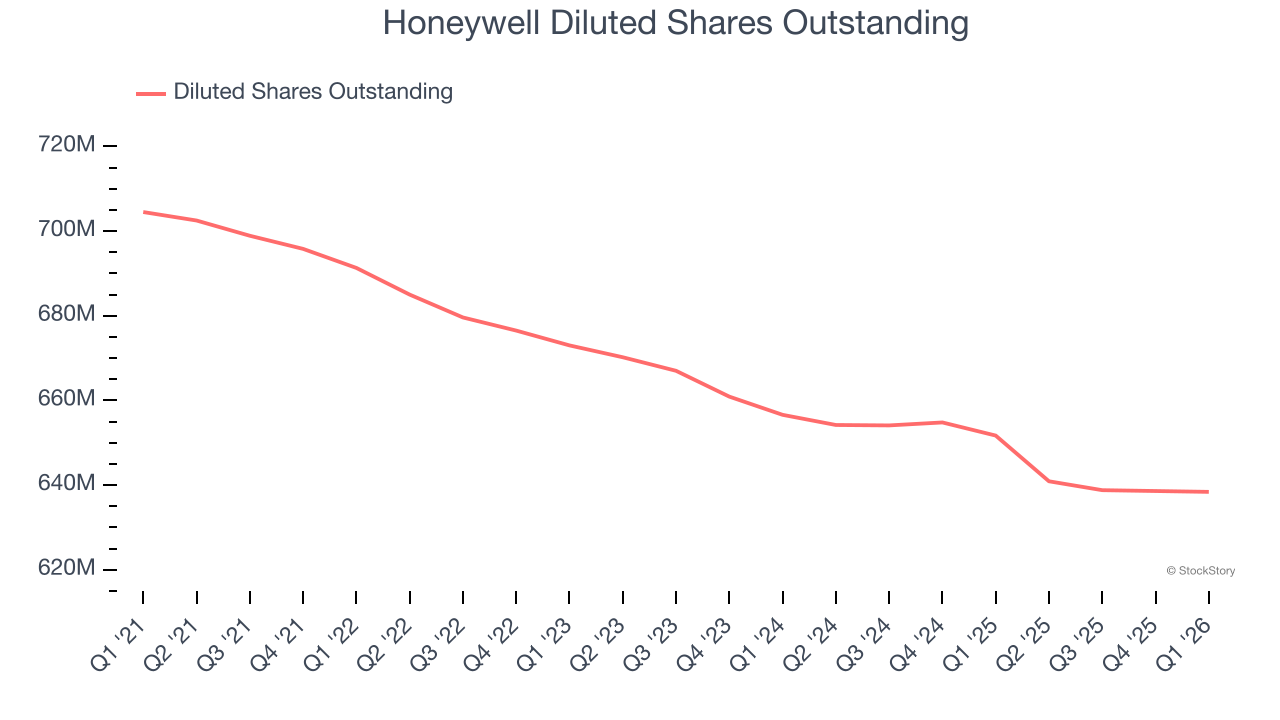
Like with revenue, we analyze EPS over a shorter period to see if we are missing a change in the business.
For Honeywell, its two-year annual EPS growth of 6.5% was lower than its five-year trend. We hope its growth can accelerate in the future.
In Q1, Honeywell reported adjusted EPS of $2.45, down from $2.51 in the same quarter last year. Despite falling year on year, this print beat analysts’ estimates by 5.6%. Over the next 12 months, Wall Street expects Honeywell’s full-year EPS of $10.61 to grow 1.6%.
Key Takeaways from Honeywell’s Q1 Results
It was good to see Honeywell beat analysts’ EPS expectations this quarter. On the other hand, its adjusted operating income missed and its organic revenue fell short of Wall Street’s estimates. Overall, this was a weaker quarter. The stock traded down 7% to $204.50 immediately following the results.
Honeywell didn’t show it’s best hand this quarter, but does that create an opportunity to buy the stock right now? When making that decision, it’s important to consider its valuation, business qualities, as well as what has happened in the latest quarter. We cover that in our actionable full research report which you can read here (it’s free).