

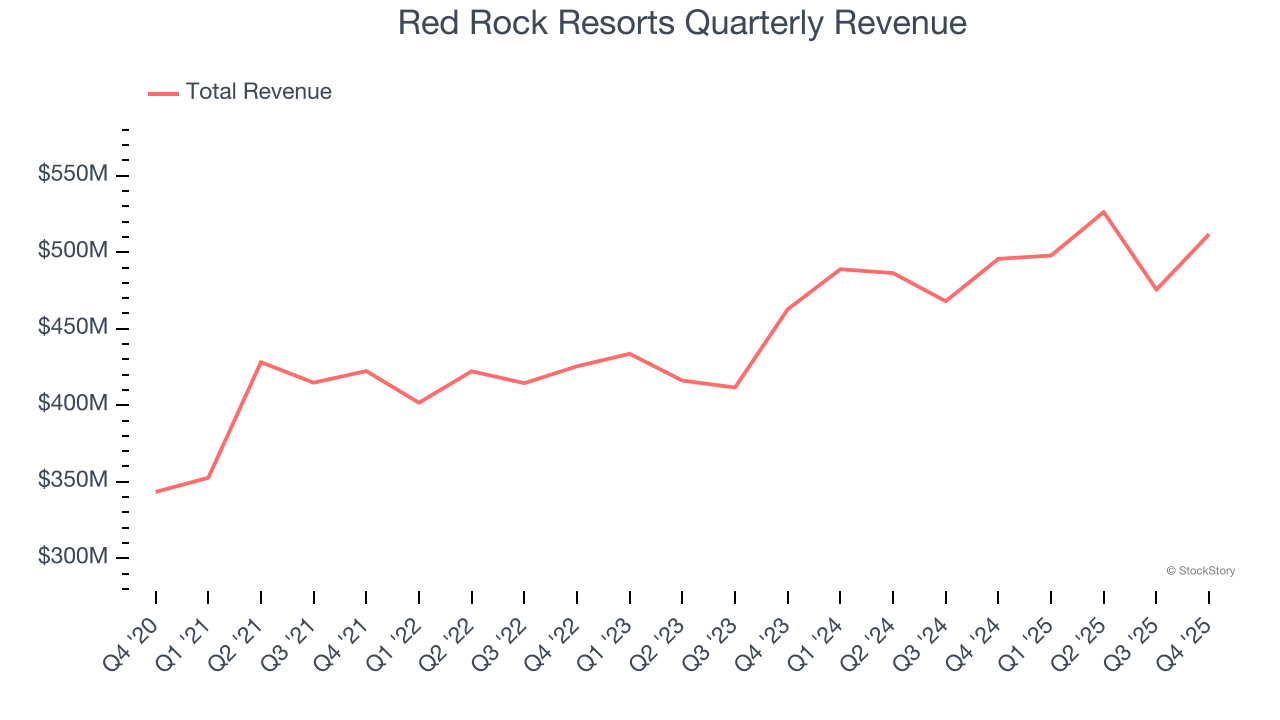
Casino resort and entertainment company Red Rock Resorts (NASDAQ:RRR) reported Q4 CY2025 results exceeding the market’s revenue expectations, with sales up 3.2% year on year to $511.8 million. Its GAAP profit of $0.75 per share was 67.7% above analysts’ consensus estimates.
Is now the time to buy Red Rock Resorts? Find out by accessing our full research report, it’s free.
Red Rock Resorts (RRR) Q4 CY2025 Highlights:
- Revenue: $511.8 million vs analyst estimates of $502.4 million (3.2% year-on-year growth, 1.9% beat)
- EPS (GAAP): $0.75 vs analyst estimates of $0.45 (67.7% beat)
- Adjusted EBITDA: $213.3 million vs analyst estimates of $205.9 million (41.7% margin, 3.6% beat)
- Operating Margin: 28.1%, in line with the same quarter last year
- Market Capitalization: $3.88 billion
Company Overview
Founded in 1976, Red Rock Resorts (NASDAQ:RRR) operates a range of casino resorts and entertainment properties, primarily in the Las Vegas metropolitan area.
Revenue Growth
Examining a company’s long-term performance can provide clues about its quality. Any business can have short-term success, but a top-tier one grows for years. Over the last five years, Red Rock Resorts grew its sales at a 11.2% compounded annual growth rate. Although this growth is acceptable on an absolute basis, it fell short of our standards for the consumer discretionary sector, which enjoys a number of secular tailwinds.
Long-term growth is the most important, but within consumer discretionary, product cycles are short and revenue can be hit-driven due to rapidly changing trends and consumer preferences. Red Rock Resorts’s recent performance shows its demand has slowed as its annualized revenue growth of 8% over the last two years was below its five-year trend. Note that COVID hurt Red Rock Resorts’s business in 2020 and part of 2021, and it bounced back in a big way thereafter. 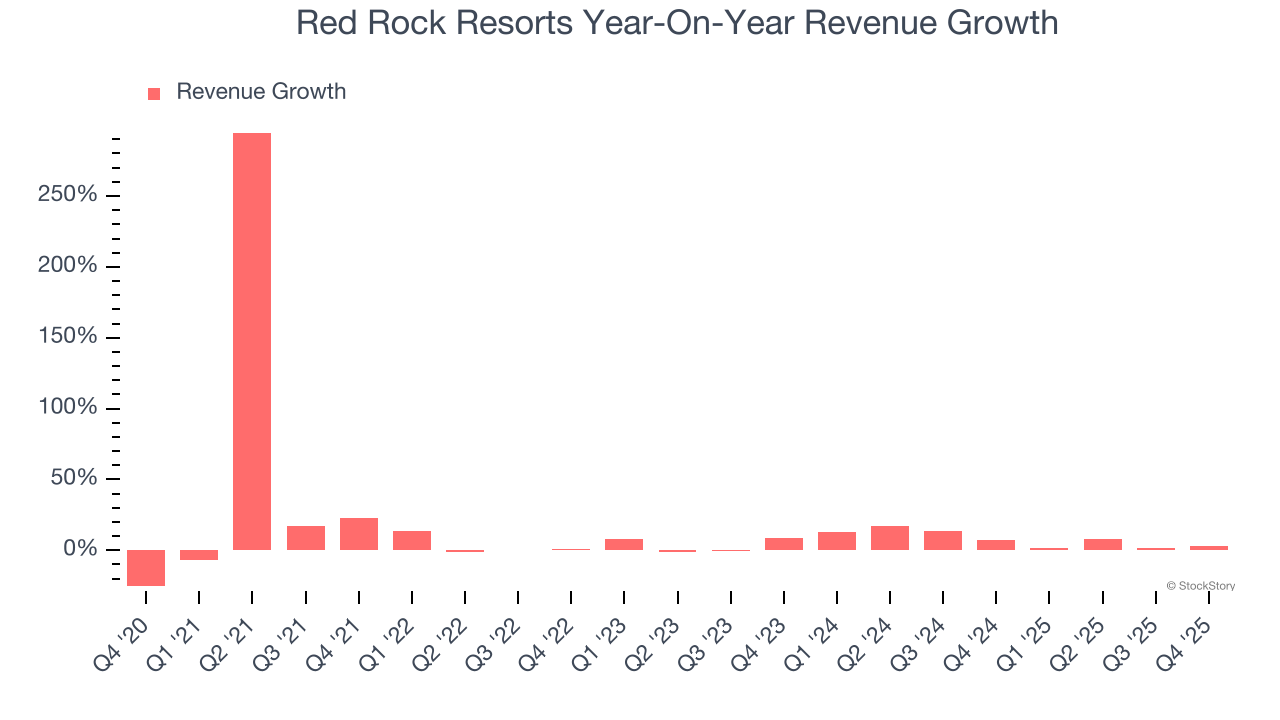
We can better understand the company’s revenue dynamics by analyzing its three most important segments: Casino, Dining, and Hotel, which are 67%, 18.2%, and 9.2% of revenue. Over the last two years, Red Rock Resorts’s Casino (Blackjack, Poker) and Dining (food and beverage) revenues averaged year-on-year growth of 7.3% and 2% while its Hotel revenue (overnight stays) averaged 8.9% declines. 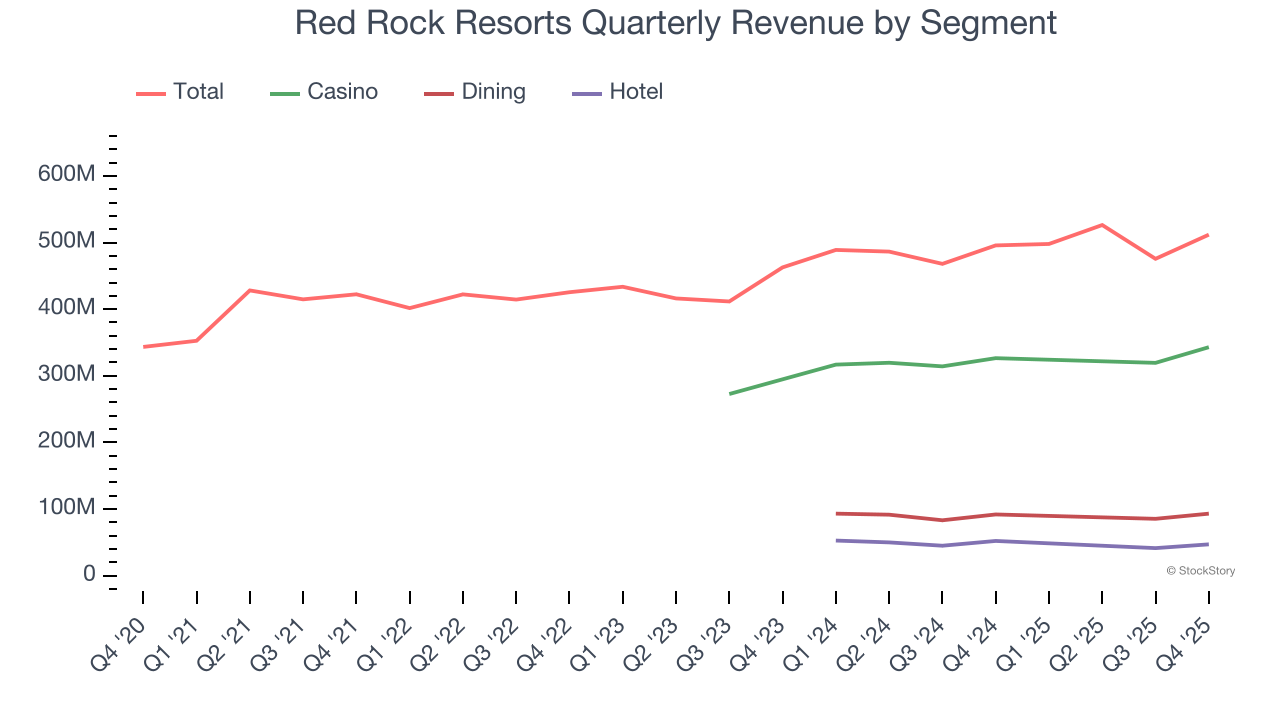
This quarter, Red Rock Resorts reported modest year-on-year revenue growth of 3.2% but beat Wall Street’s estimates by 1.9%.
Looking ahead, sell-side analysts expect revenue to grow 2.2% over the next 12 months, a deceleration versus the last two years. This projection is underwhelming and suggests its products and services will face some demand challenges.
Microsoft, Alphabet, Coca-Cola, Monster Beverage—all began as under-the-radar growth stories riding a massive trend. We’ve identified the next one: a profitable AI semiconductor play Wall Street is still overlooking. Go here for access to our full report.
Operating Margin
Operating margin is an important measure of profitability as it shows the portion of revenue left after accounting for all core expenses – everything from the cost of goods sold to advertising and wages. It’s also useful for comparing profitability across companies with different levels of debt and tax rates because it excludes interest and taxes.
Red Rock Resorts’s operating margin might fluctuated slightly over the last 12 months but has remained more or less the same, averaging 29.6% over the last two years. This profitability was paltry for a consumer discretionary business and caused by its suboptimal cost structure.
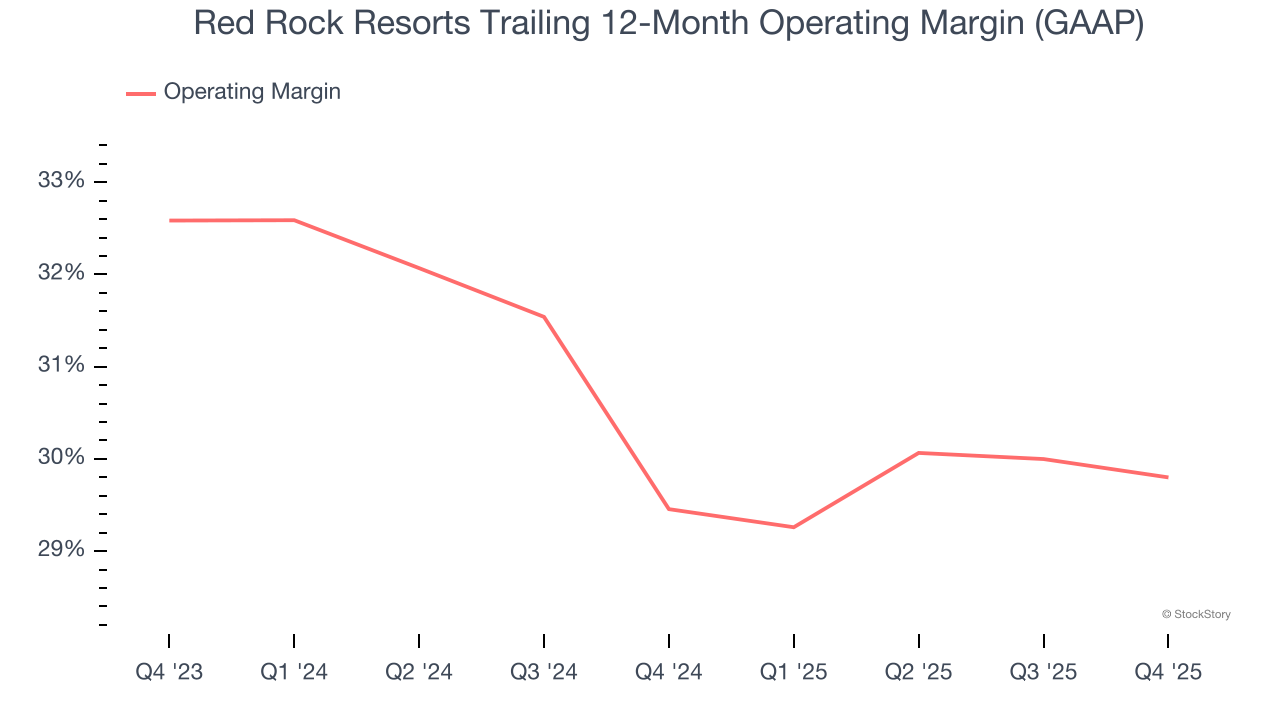
This quarter, Red Rock Resorts generated an operating margin profit margin of 28.1%, in line with the same quarter last year. This indicates the company’s overall cost structure has been relatively stable.
Earnings Per Share
Revenue trends explain a company’s historical growth, but the long-term change in earnings per share (EPS) points to the profitability of that growth – for example, a company could inflate its sales through excessive spending on advertising and promotions.
Red Rock Resorts’s full-year EPS flipped from negative to positive over the last five years. This is encouraging and shows it’s at a critical moment in its life.
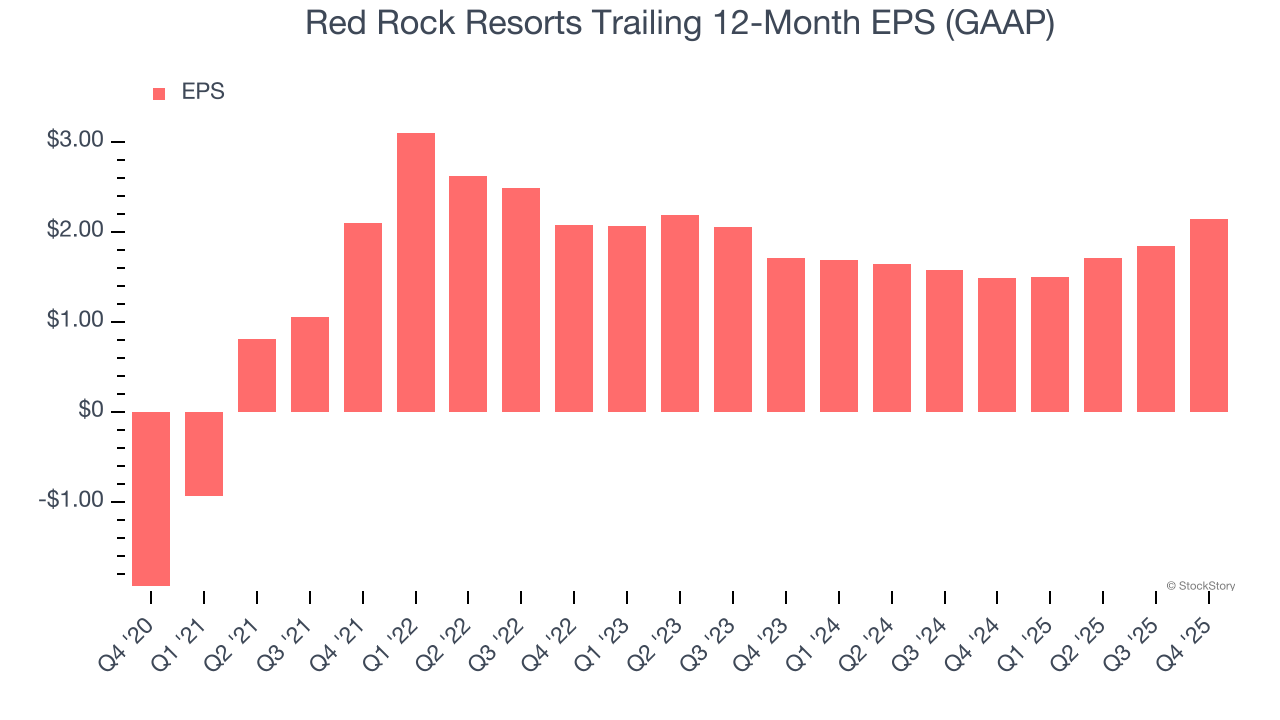
In Q4, Red Rock Resorts reported EPS of $0.75, up from $0.45 in the same quarter last year. This print easily cleared analysts’ estimates, and shareholders should be content with the results. Over the next 12 months, Wall Street expects Red Rock Resorts’s full-year EPS of $2.14 to shrink by 2.4%.
Key Takeaways from Red Rock Resorts’s Q4 Results
It was good to see Red Rock Resorts beat analysts’ EPS expectations this quarter. We were also happy its revenue outperformed Wall Street’s estimates. Overall, we think this was a solid quarter with some key areas of upside. The stock remained flat at $66.98 immediately following the results.
Red Rock Resorts had an encouraging quarter, but one earnings result doesn’t necessarily make the stock a buy. Let’s see if this is a good investment. We think that the latest quarter is only one piece of the longer-term business quality puzzle. Quality, when combined with valuation, can help determine if the stock is a buy. We cover that in our actionable full research report which you can read here (it’s free).