

Online fashion resale marketplace ThredUp (NASDAQ:TDUP) met Wall Street’s revenue expectations in Q3 2026, with revenue up 7.4% year on year to $88.23 million. On the other hand, next quarter’s revenue guidance of $78 million was less impressive, coming in 9.6% below analysts’ consensus estimates. Its GAAP loss of $0.04 per share was in line with analysts’ consensus estimates.
For more on ThredUp, read our full research report, available free.
ThredUp (TDUP) Q3 2026 highlights:
- Revenue $88.23 million vs S&P analysts’ consensus estimates of $88.06 million (7.4% year-on-year growth, in line)
- EPS (GAAP) -$0.04 vs analysts’ consensus estimates of -$0.04 (in line)
- Adjusted EBITDA $3.52 million vs analysts’ consensus estimates of $3.52 million (4% margin, relatively in line)
- Revenue guidance $78 million at the midpoint for Q4 2026, below analysts’ consensus estimates of $86.24 million
- Operating margin -6%, in line with the same quarter last year
- Free cash flow margin 0%, down from 2.9% in the same quarter last year
- Orders increased by 250,000 year on year
- Market capitalization $262.7 million
“We're proud to report a record quarter for active buyers, orders and items sold, delivering clear value for our buyers in Q3," said ThredUp CEO and co-founder James Reinhart. “Even as we navigate a highly competitive environment, we remain focused on innovating across the product experience to compound our competitive advantages as a managed marketplace.”
Revenue growth
A company’s long-term revenue performance can indicate its overall quality. Any business can deliver a good quarter or two, but the best consistently grow over the long haul. ThredUp’s revenue grew at a weak 6.2% annualized rate over the last five years, falling short of the consumer discretionary sector benchmark.
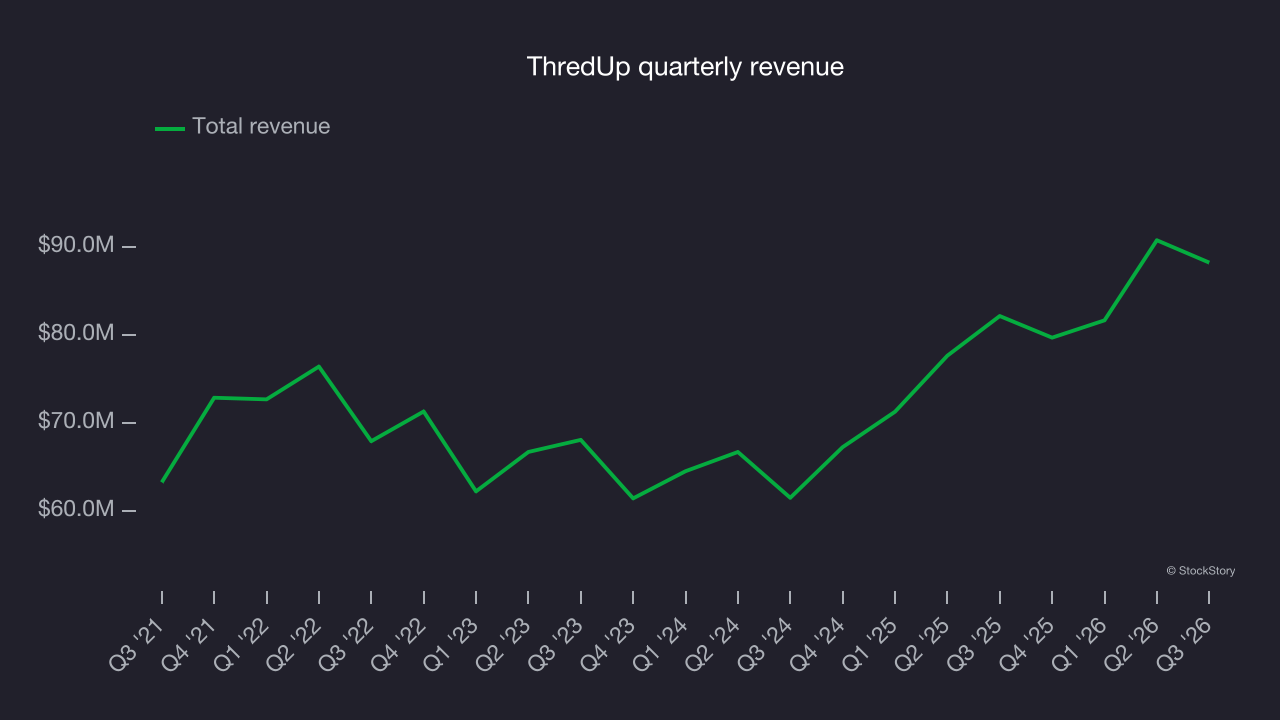
Long-term growth is the most important, but within consumer discretionary, product cycles are short and revenue can be hit-driven due to rapidly changing trends and consumer preferences. ThredUp’s annualized revenue growth of 15.7% over the last two years is above its five-year trend, a positive sign. 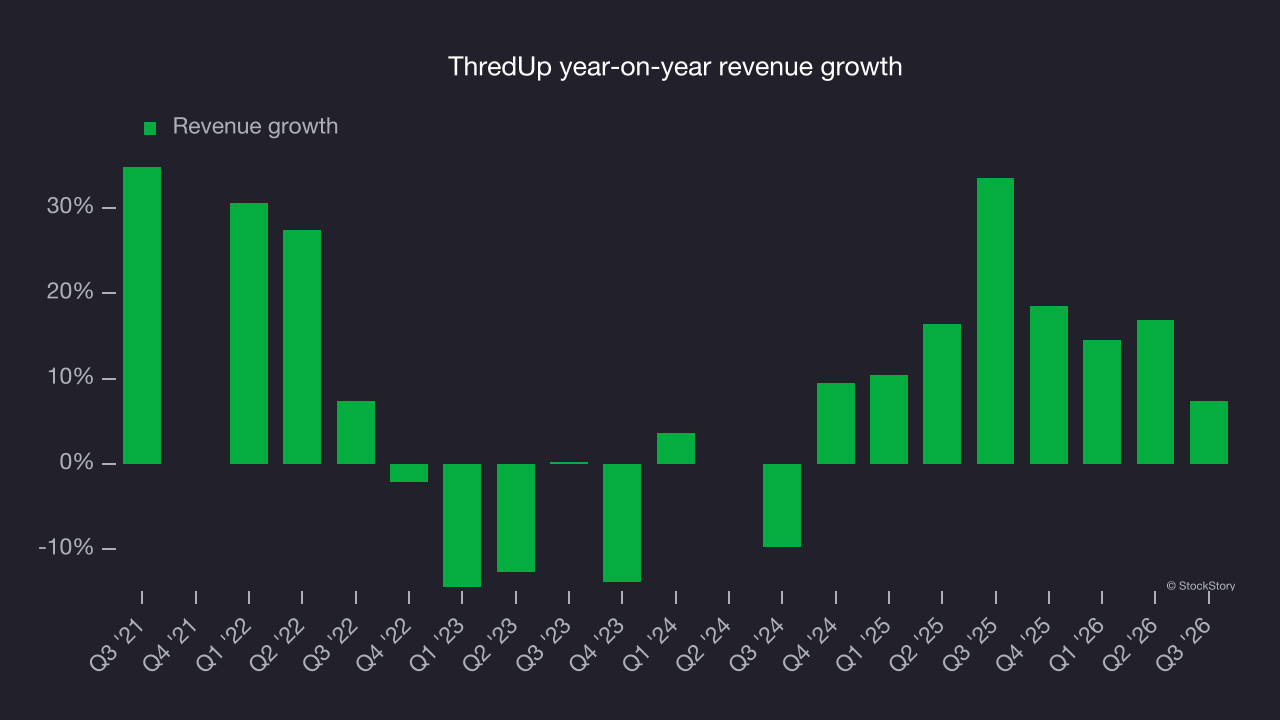
ThredUp also discloses its number of orders, which reached 1.82 million in the latest quarter. Over the last two years, ThredUp’s orders averaged 3.1% year-on-year growth. Revenue growth outpaced order growth during the same period, indicating that the company’s monetization has risen. 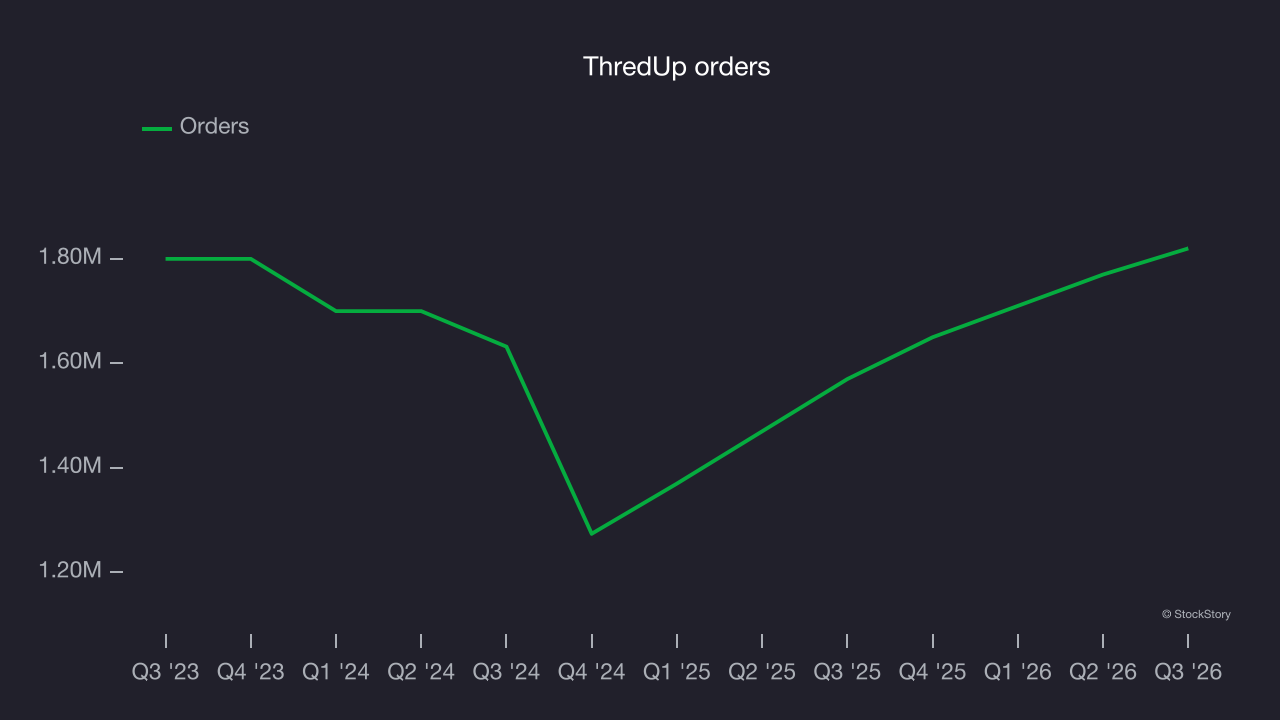
This quarter, ThredUp grew its revenue by 7.4% year on year, and its $88.23 million of revenue was in line with Wall Street’s consensus estimates. Management is guiding for a 2.1% year-on-year decline in revenue next quarter.
Looking further ahead, sell-side analysts expect revenue to grow 9.3% over the next 12 months, according to S&P, a deceleration versus the last two years. This underwhelming projection implies its products and services will face some demand challenges.
Operating margin
ThredUp’s operating margin has generally stayed the same over the last 12 months, averaging negative 7.5% over the last two years. Unprofitable consumer discretionary companies that fail to narrow their losses or grow revenue rapidly deserve extra scrutiny. For the time being, it’s unclear if ThredUp’s business model is sustainable.
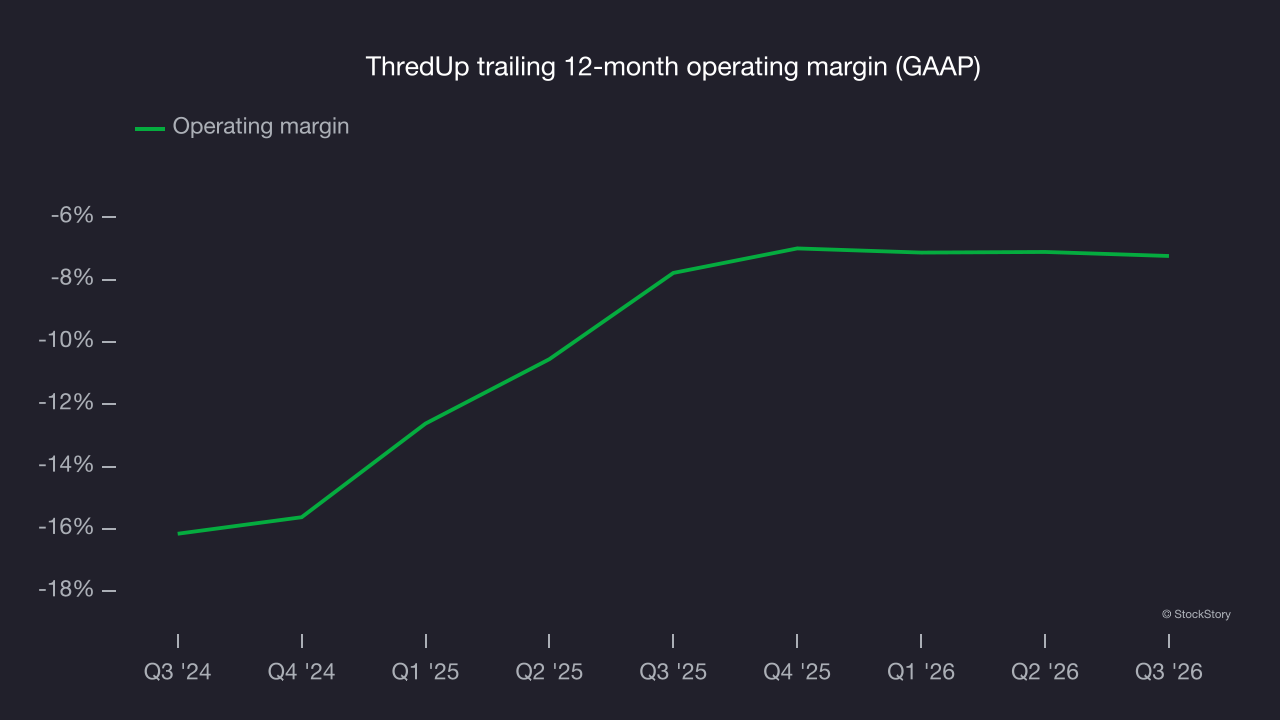
In Q3, ThredUp generated a negative 6% operating margin. The company’s consistent lack of profits raises concerns.
Earnings per share
Long-term changes in earnings per share, or EPS, matter for the same reason as long-term revenue growth. Compared to revenue, however, EPS highlights whether a company’s growth is profitable.
Although ThredUp’s full-year earnings are still negative, it reduced its losses and improved its EPS by 41.2% annually over the last five years. The next few quarters will be critical for assessing its long-term profitability.
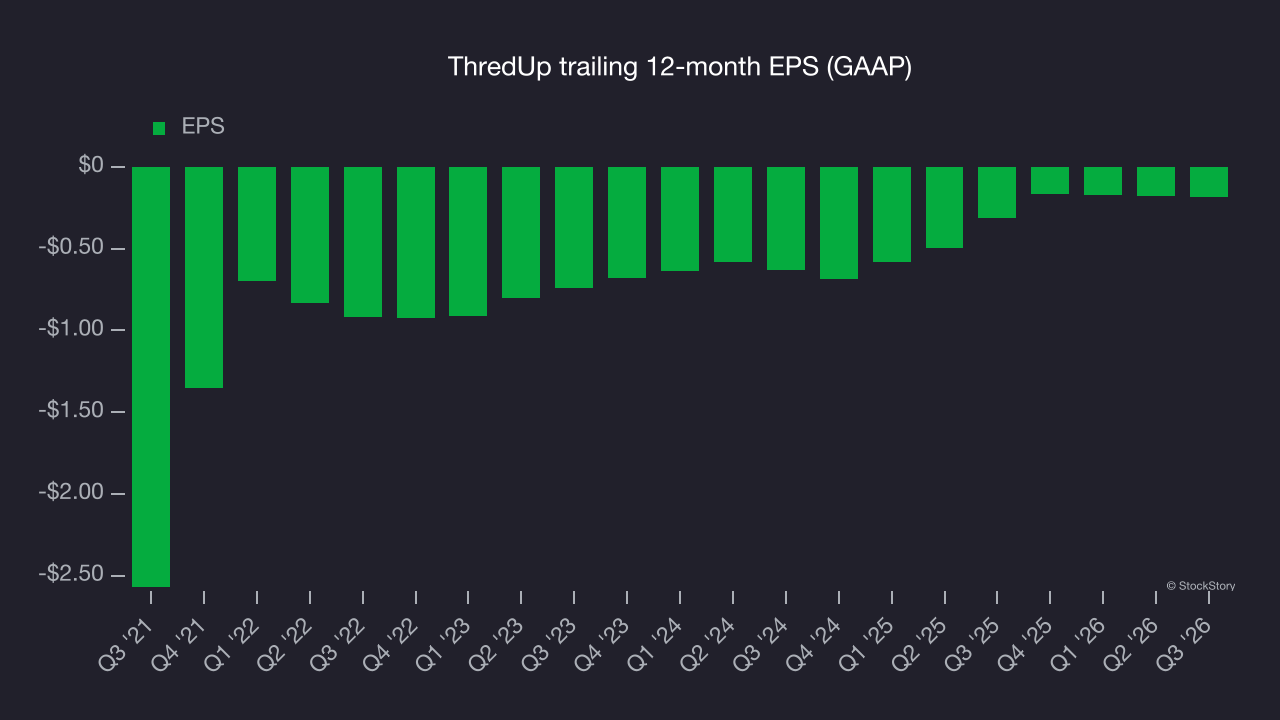
In Q3, ThredUp reported EPS of negative $0.04, in line with the same quarter last year. This result beat analysts’ consensus estimates by 9.1%. Over the next 12 months, Wall Street expects ThredUp to narrow its losses. Analysts forecast its full-year EPS will improve from negative $0.18 to negative $0.13, according to S&P.
Key takeaways from ThredUp’s Q3 results
ThredUp’s quarter could have been better: EPS met analysts’ consensus estimates, but the revenue outlook fell short. Both next-quarter and full-year revenue guidance missed Wall Street’s consensus estimates. Shares plunged 19.7% to $1.78 immediately after the results.
ThredUp’s results fell short this quarter, but one report doesn’t determine whether the stock offers an investment opportunity. What happened in the latest quarter matters, but not as much as longer-term business quality and valuation when deciding whether to invest. For more on those factors, read the full research report here (it’s free).