

Oil and gas producer Magnolia Oil & Gas (NYSE:MGY) reported Q3 2026 results exceeding the market’s revenue expectations, with revenue up 58.2% year on year to $513.9 million. Its GAAP profit of $0.35 per share was 32.7% below analysts’ consensus estimates.
For more on Magnolia Oil & Gas, read our free full research report.
Magnolia Oil & Gas (MGY) Q3 2026 highlights:
- Revenue $513.9 million vs S&P analysts’ consensus estimates of $482.5 million (58.2% year-on-year growth, 6.5% beat)
- EPS (GAAP) $0.35 vs analysts’ consensus estimates of $0.52 (32.7% miss)
- Operating margin 30.1%, down from 31.2% in the same quarter last year
- Free cash flow margin 42.5%, up from 39.4% in the same quarter last year
- Oil production rose 24.5% year on year
- Market capitalization $5.84 billion
“Magnolia continues to execute at a high level as we successfully integrate the WildFire assets,” said Magnolia’s Chairman, President and CEO Chris Stavros. “Although our third quarter results include only a partial period of ownership following the September closing, the benefits of the combined asset base are already clearly evident. Our business generated $224 million of adjusted free cash flow during the quarter, with a reinvestment rate of just 38 percent of adjusted EBITDAX. That strong momentum has carried into the fourth quarter – our first full quarter as a combined company.
Revenue growth
Cyclical industries such as energy can make mediocre companies look strong for a time, but a long-term view reveals which businesses can actually withstand and adapt to changing conditions. Magnolia Oil & Gas’s 13.4% annualized revenue growth over the last five years was solid. Its growth beat the average energy upstream and integrated energy company and shows its offerings resonate with customers.
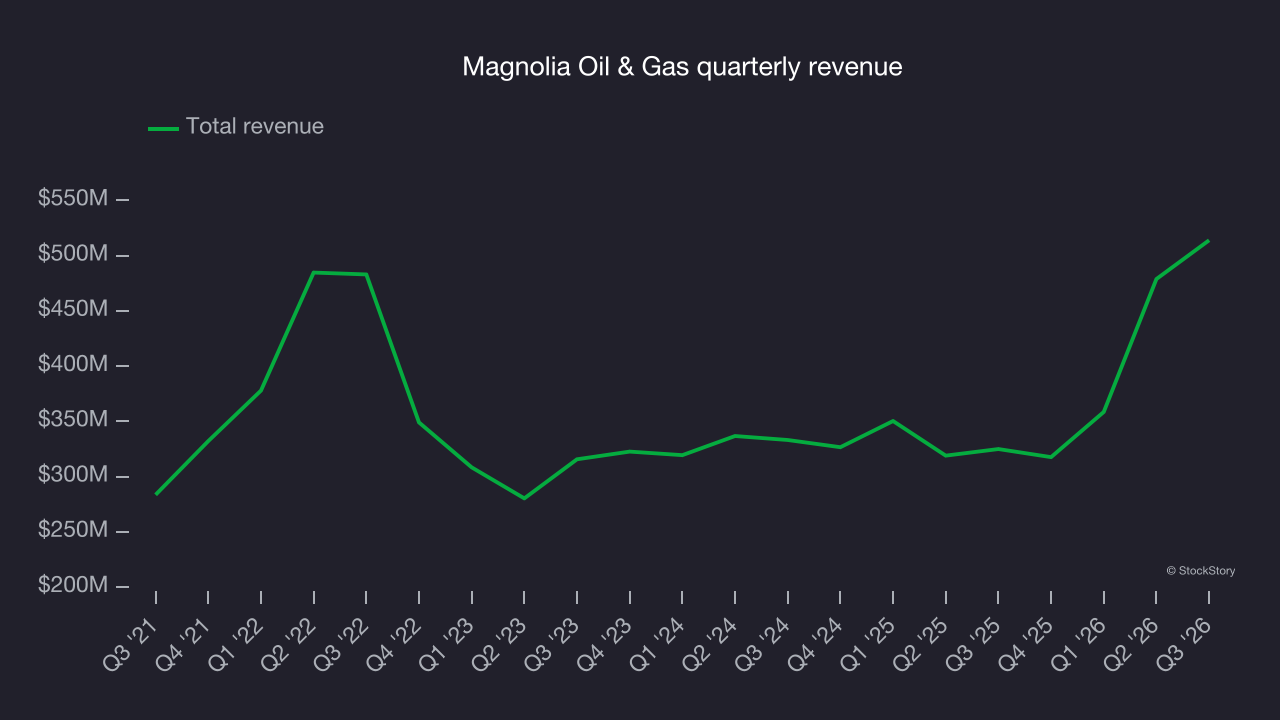
Within energy, a single time frame, even if it’s quite long-term, only sheds light on how well a company rode the last commodity cycle. To better assess whether a company compounds through cycles, an even longer, ten-year view helps validate that assessment. Magnolia Oil & Gas’s annualized revenue growth of 2.4% over the last nine years is below its five-year trend, but the results were still respectable.
Revenue provides useful context, but it is heavily influenced by commodity prices and acquisitions. Production volumes, by contrast, reveal whether the underlying asset base is actually growing. Over the last two years, Magnolia Oil & Gas’s oil production averaged 7.2% year-on-year growth while its natural gas liquids production averaged 13.4% year-on-year growth.
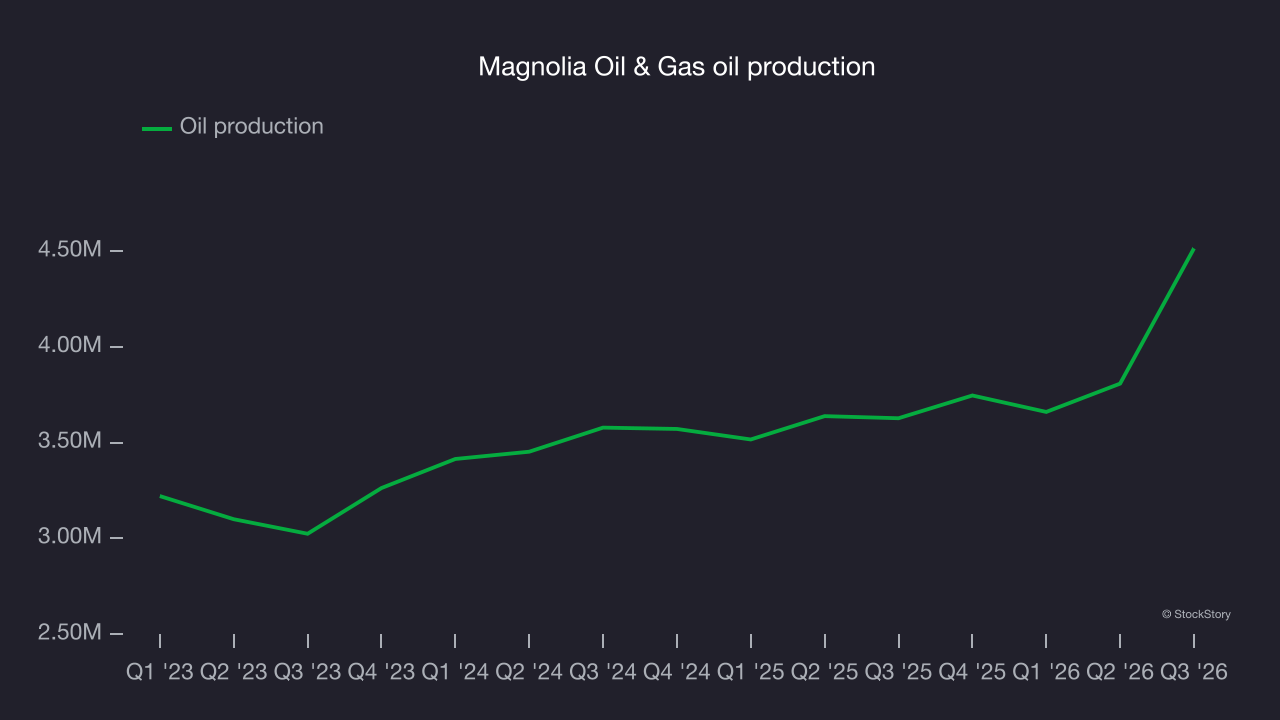
This quarter, Magnolia Oil & Gas reported year-on-year revenue growth of 58.2%, and its $513.9 million of revenue beat Wall Street’s consensus estimates by 6.5%. The company also reported strong year-on-year oil production growth of 24.5%.
Adjusted EBITDA margin
Adjusted EBITDA margin is an important measure of profitability for the sector and accounts for the gross margins and operating costs mentioned previously. Unlike operating margin, it is not distorted by accounting conventions around reserves, drilling costs and assumptions on commodity consumption from the well or basin. Adjusted EBITDA highlights the economic reality of how much cash the rock produces before the capital structure (debt service) and the drilling budget (capex) are considered.
Magnolia Oil & Gas has performed well over the last five years. It demonstrated strong profitability for an upstream and integrated energy business, with an average EBITDA margin of 71.1%.
Analyzing the trend in its profitability, Magnolia Oil & Gas’s EBITDA margin decreased by 11.2 percentage points over the last year. This raises questions about the company’s expense base because its revenue growth should have given it leverage on its fixed costs, resulting in better economies of scale and profitability.
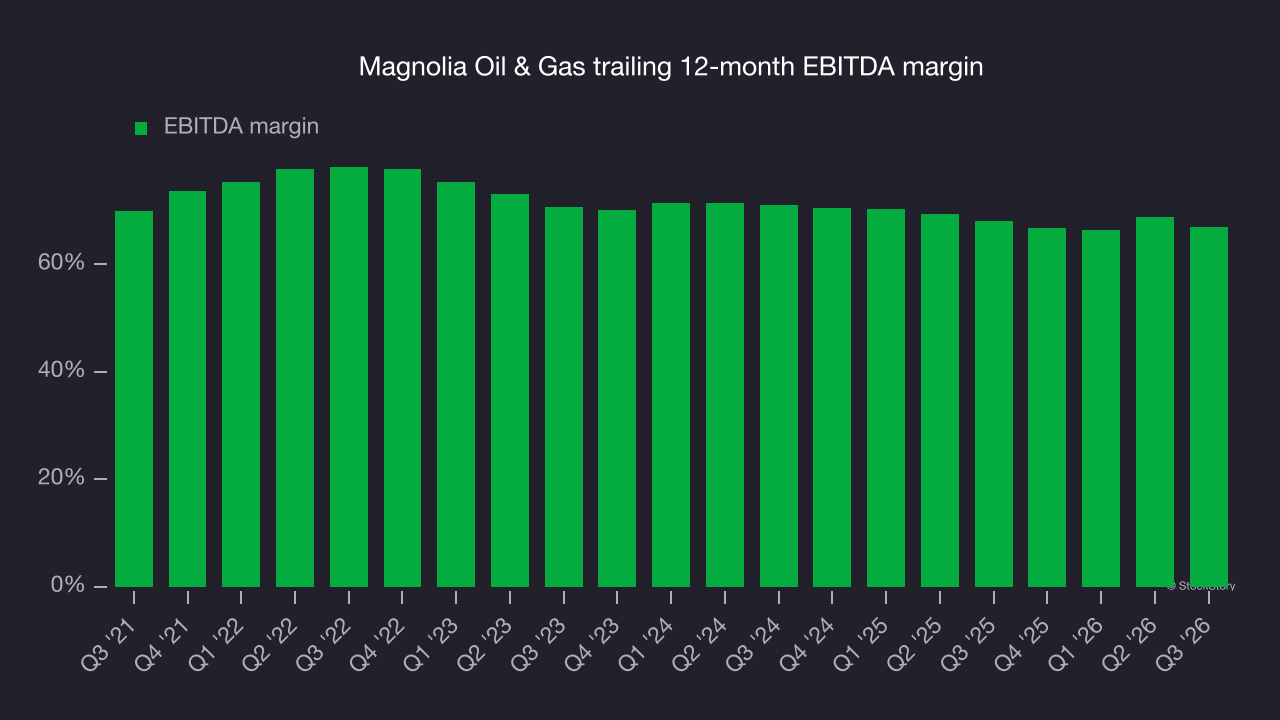
In Q3, Magnolia Oil & Gas generated an EBITDA margin of 60.8%, down 4.5 percentage points year on year. This contraction shows it was less efficient because its expenses grew faster than its revenue. Adjusted EBITDA fell short of Wall Street’s consensus estimates.
Free cash flow
Adjusted EBITDA shows how profitable a company’s existing wells are before financing and reinvestment decisions, but free cash flow shows how much value remains after paying the cost of replacing those wells. In upstream energy, production naturally declines over time, so companies must continuously reinvest just to stand still. A producer can report strong EBITDA margins yet generate little or no free cash flow if its wells decline quickly or if new drilling is expensive. Free cash flow therefore captures not only how efficiently a company produces hydrocarbons today, but also how costly it is to sustain that production into the future.
Magnolia Oil & Gas has shown strong cash profitability, driven by its profitable business model that enables it to reinvest, return capital to investors and stay ahead of the competition. The company’s free cash flow margin was among the best in the energy upstream and integrated energy sector, averaging 39.3% over the last five years.
While the level of free cash flow margins is important, their consistency matters just as much.
Magnolia Oil & Gas’s ratio of quarterly free cash flow volatility to volatility in West Texas Intermediate, or WTI, crude prices over the past five years was 3.2 (lower is better), indicating strong insulation from commodity swings. This stability supports superior capital access in downturns and positions Magnolia Oil & Gas to act as a consolidator when weaker peers are forced to retrench.
Why compare free cash flow with commodity prices rather than revenue or EBITDA with WTI for Magnolia Oil & Gas? What ultimately matters is not how much revenue or profit a company earns when prices are high but how much cash it can generate when prices are low. Free cash flow is the superior metric because it includes everything from hedging effectiveness to growth and maintenance capex to management behavior during good times and bad.
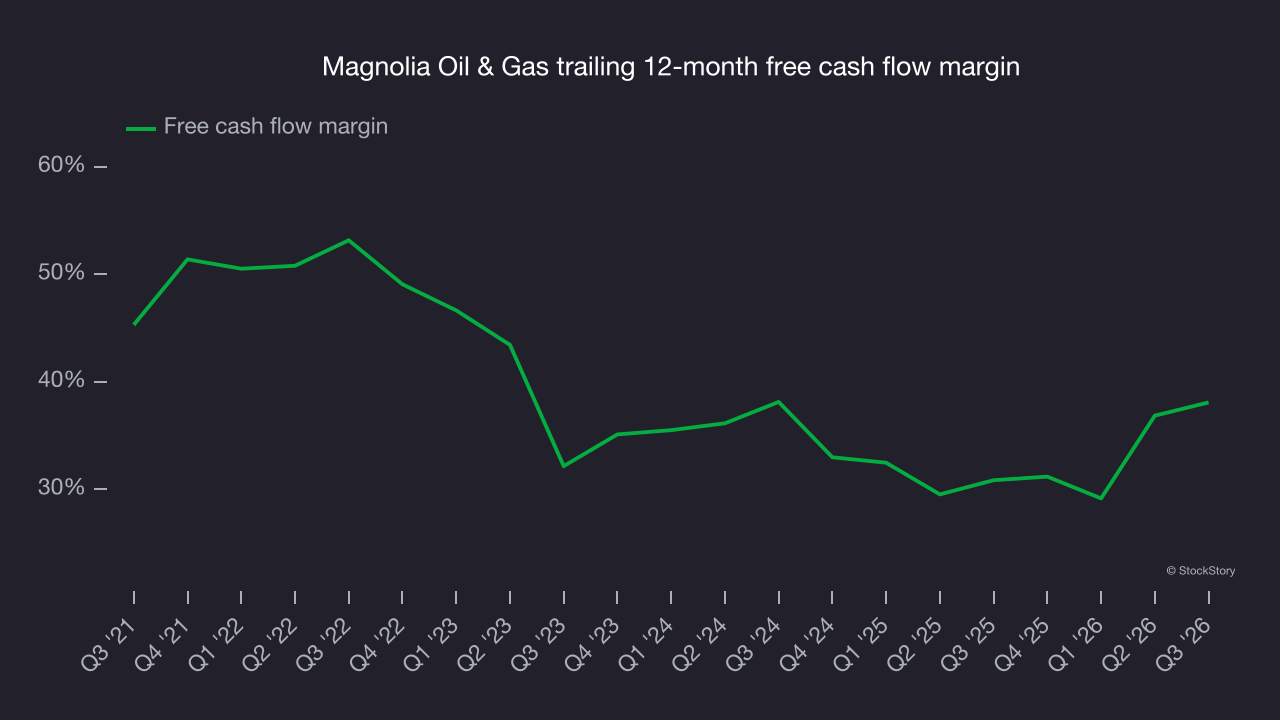
Magnolia Oil & Gas’s free cash flow was $218.2 million in Q3, equivalent to a 42.5% margin. This was a positive result, as its margin was 3.1 percentage points higher than in the same quarter last year. Its cash profitability was also above its five-year level.
Key takeaways from Magnolia Oil & Gas’s Q3 results
Magnolia Oil & Gas’s quarter was mixed overall despite revenue coming in well above analysts’ consensus estimates. EPS missed expectations. Shares remained flat at $24.02 immediately after the results.
Magnolia Oil & Gas underperformed this quarter. Assessing whether the stock offers an investment opportunity requires considering the broader picture of valuation, business quality and the latest earnings. Read the full research report here (it’s free).