

3D printing company 3D Systems (NYSE:DDD) reported Q3 2026 results exceeding the market’s revenue expectations, with revenue up 8.8% year on year to $99.3 million. On the other hand, next quarter’s revenue guidance of $101.5 million was less impressive, coming in 4.1% below analysts’ consensus estimates. Its non-GAAP loss of $0.06 per share was $0.02 below analysts’ consensus estimates.
For more on 3D Systems, read our full research report for free.
3D Systems (DDD) Q3 2026 highlights:
- Revenue $99.3 million vs S&P analysts’ consensus estimates of $97.51 million (8.8% year-on-year growth, 1.8% beat)
- Adjusted EPS -$0.06 vs S&P analysts’ consensus estimates of -$0.04 ($0.02 miss)
- Adjusted EBITDA $3.1 million (3.1% margin, 132% year-on-year growth)
- Revenue guidance $101.5 million at the midpoint for Q4 2026, below analysts’ consensus estimates of $105.9 million
- EBITDA guidance -$1 million at the midpoint for Q4 2026, above analysts’ consensus estimates of -$1.02 million
- Adjusted EBITDA margin 3.1%, up from -10.7% in the same quarter last year
- Free cash flow -$5.82 million compared to -$15.75 million in the same quarter last year
- Market capitalization $453.6 million
Dr. Jeffrey Graves, President and Chief Executive Officer of 3D Systems, said, “We are pleased with our third-quarter and year-to-date performance. Revenue growth accelerated, Adjusted EBITDA turned positive for the quarter and the year-to-date period, and our four strategic markets, Med Tech, Dental, Aerospace & Defense, and Data Center Infrastructure, continued to deliver strong double-digit growth. These results reflect the progress we have made executing a focused strategy: concentrating resources on high-value production applications, refreshing our product portfolio, and expanding our metal parts manufacturing capability. Customers in these markets are increasingly adopting 3D printing as a core manufacturing technology, and the combination of design flexibility and production economics is enabling higher-performance components and systems to move into full production.”
Revenue growth
A company’s long-term revenue performance can indicate its overall quality. Any business can deliver a good quarter or two, but many enduring ones grow for years. 3D Systems’s demand was weak over the last five years as its revenue fell at a 9.1% annual rate. That outcome points to poor business quality.
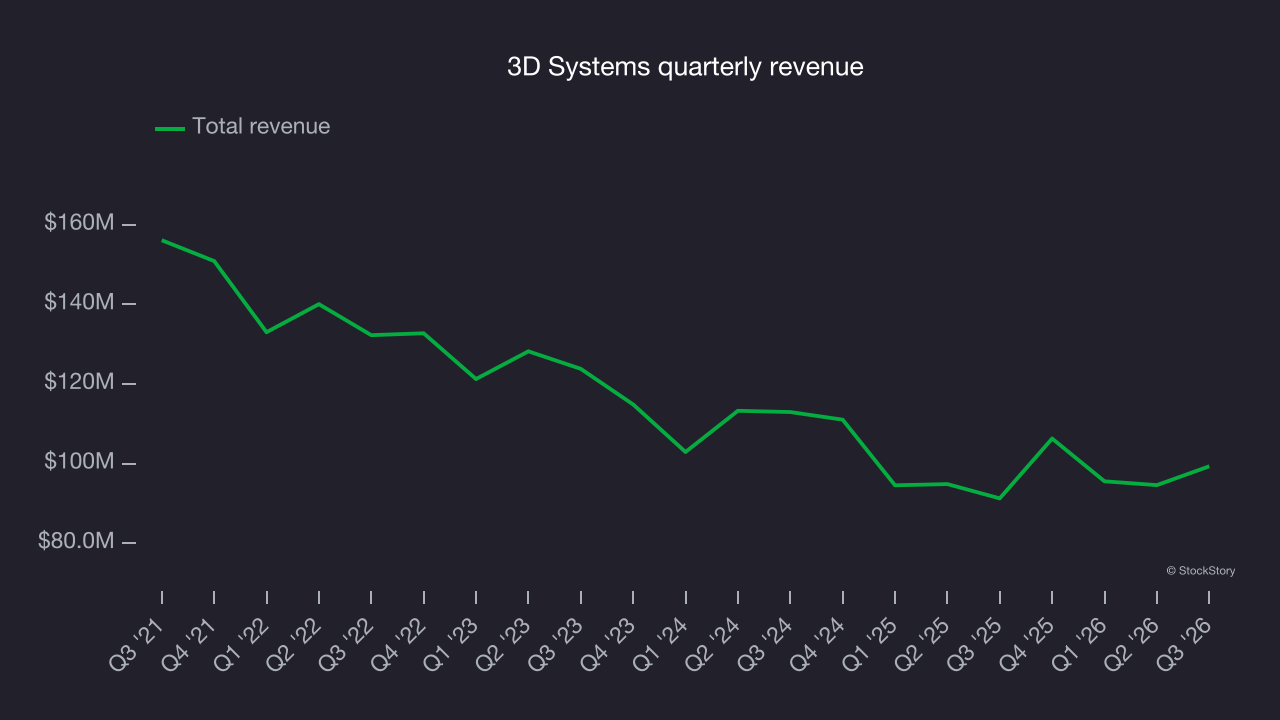
Long-term growth matters most, but within industrials, a half-decade historical view may miss cycles, industry trends or a company capitalizing on catalysts such as a new contract win or a successful product line. 3D Systems’s annualized revenue declines of 5.6% over the last two years suggest its demand continued shrinking. 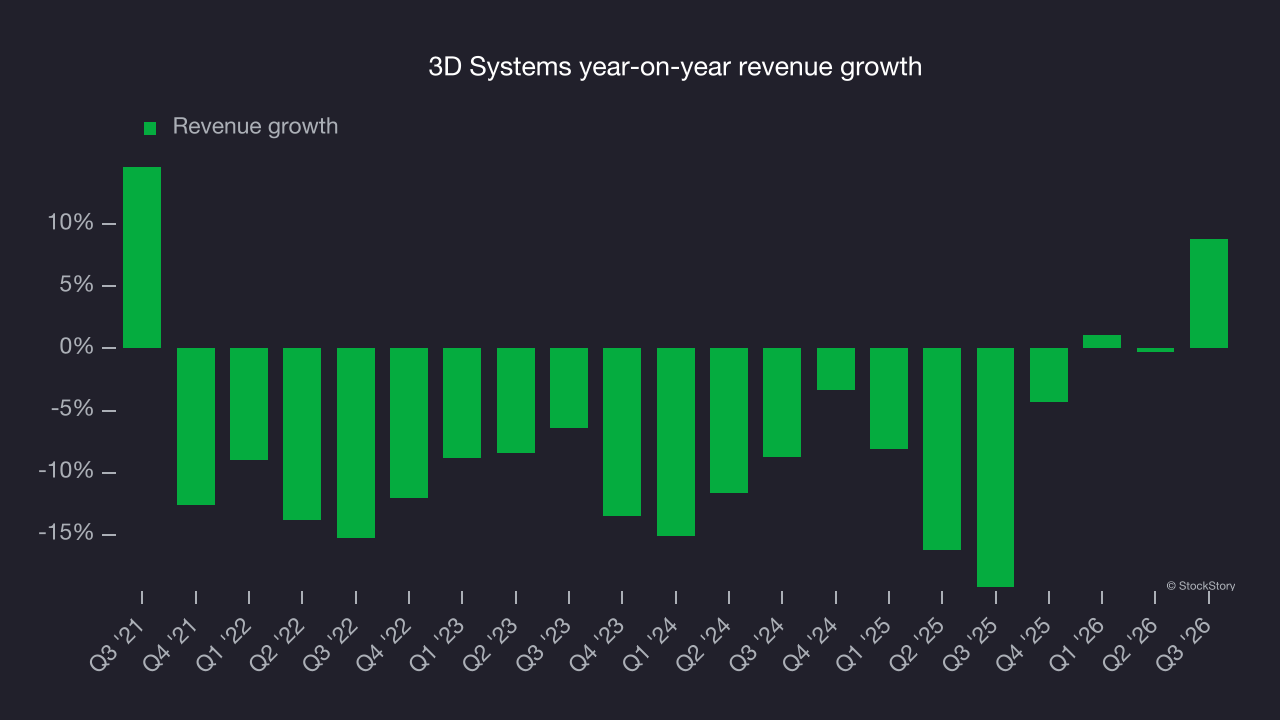
3D Systems also breaks out the revenue for its most important segments, Industrial and Healthcare, which are 49.3% and 50.7% of revenue. Over the last two years, 3D Systems’s Industrial revenue (aerospace, defense and transportation manufacturing) averaged 4.9% year-on-year declines while its Healthcare revenue (dental and medical devices) was flat. 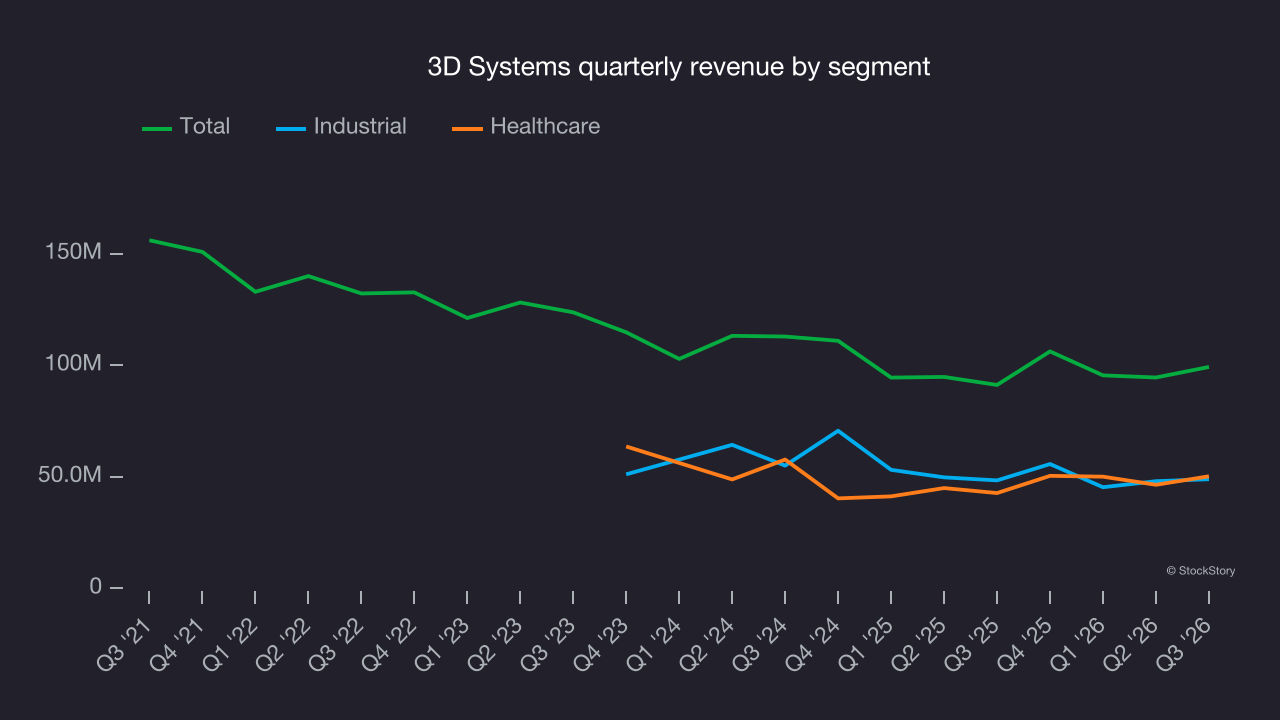
This quarter, 3D Systems reported year-on-year revenue growth of 8.8%, and its $99.3 million in revenue exceeded Wall Street’s consensus estimates by 1.8%. Management is guiding for a 4.5% year-on-year decline in revenue next quarter.
Looking further ahead, sell-side analysts expect revenue to grow 1.7% over the next 12 months, according to S&P. Although this projection suggests its newer products and services will spur better top-line performance, it is still below average for the sector.
Operating margin
3D Systems’s operating margin has been trending up over the last 12 months, but it still averaged negative 41.1% over the last five years. This is due to its large expense base and inefficient cost structure.
Analyzing the trend in its profitability, 3D Systems’s operating margin might have fluctuated slightly but has generally stayed the same over the last five years, an unfavorable pattern.
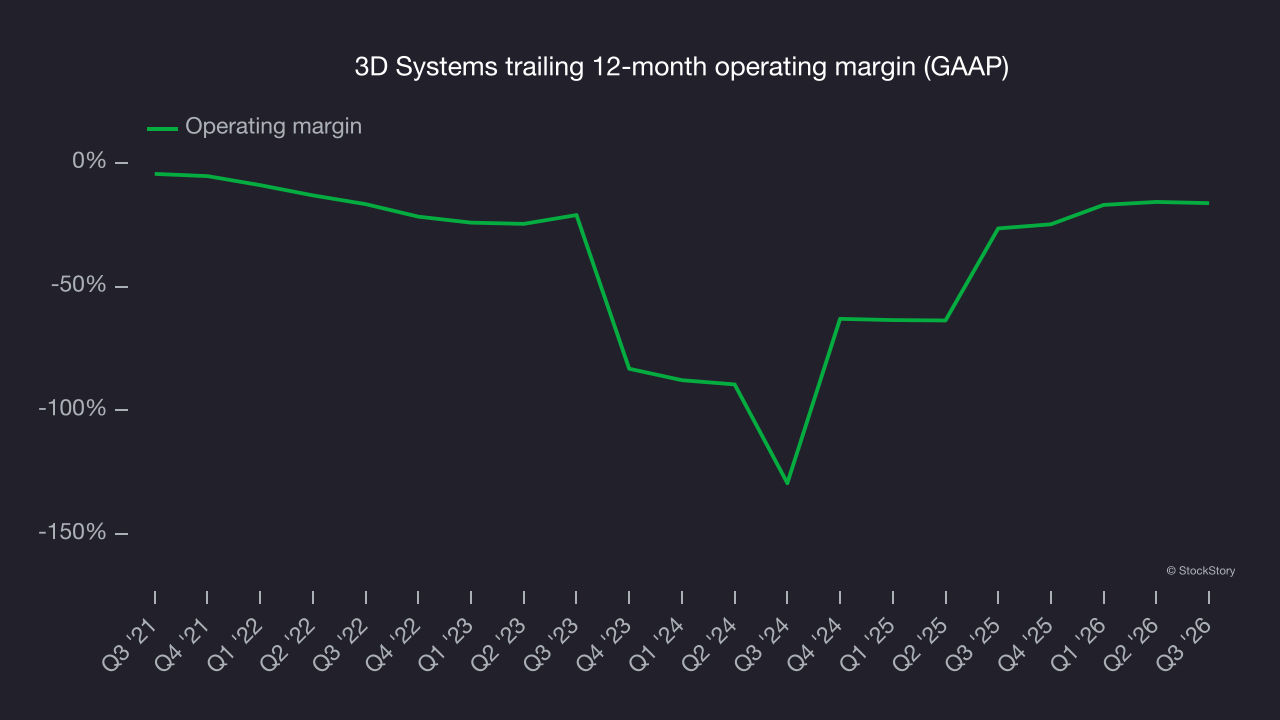
3D Systems’s operating margin was negative 24.7% this quarter. The company’s consistent lack of profits raises concerns.
Earnings per share
Revenue trends explain a company’s historical growth, but the long-term change in earnings per share (EPS) points to the profitability of that growth. For example, a company could inflate its revenue through excessive spending on advertising and promotions.
3D Systems’ EPS declined by 20.3% annually over the last five years, more than its revenue. This indicates the company struggled because its fixed cost base made it difficult to adjust to shrinking demand.
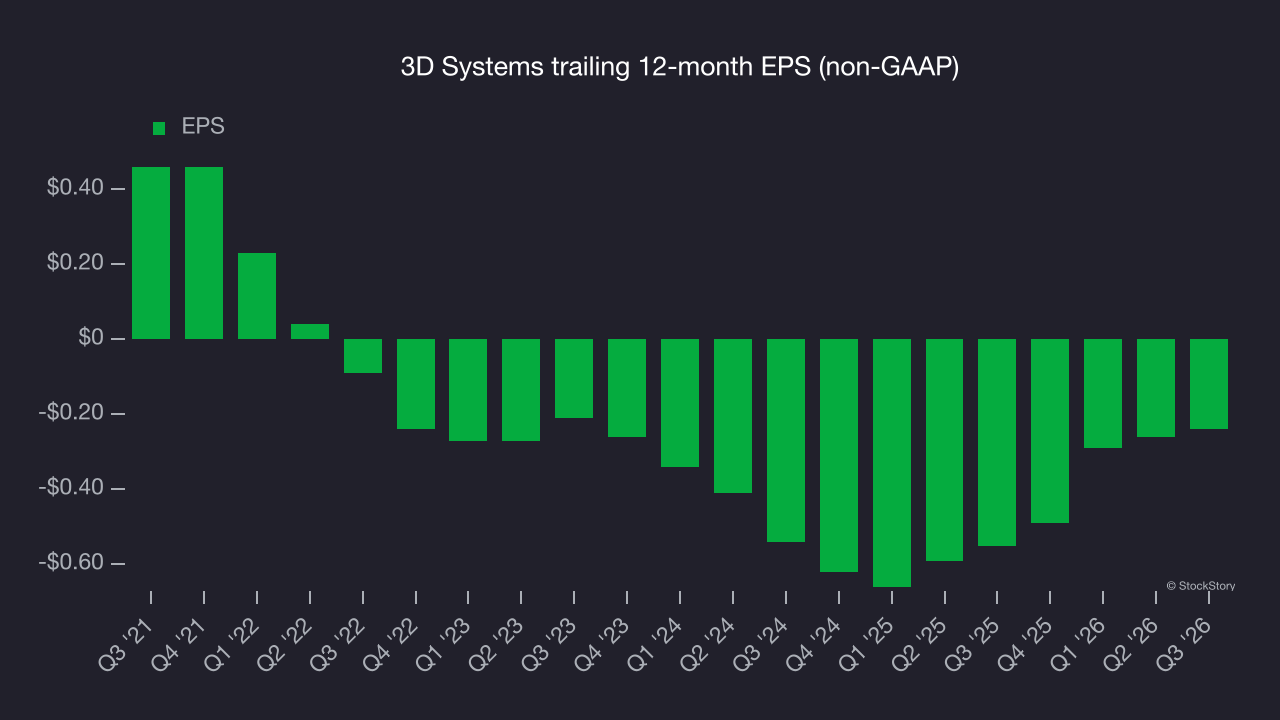
Diving into the nuances of 3D Systems’s earnings can give us a better understanding of its performance. A five-year view shows 3D Systems has diluted its shareholders, growing its share count by 30%. This has led to lower per share earnings. Taxes and interest expenses can also affect EPS but don’t tell us as much about a company’s fundamentals. 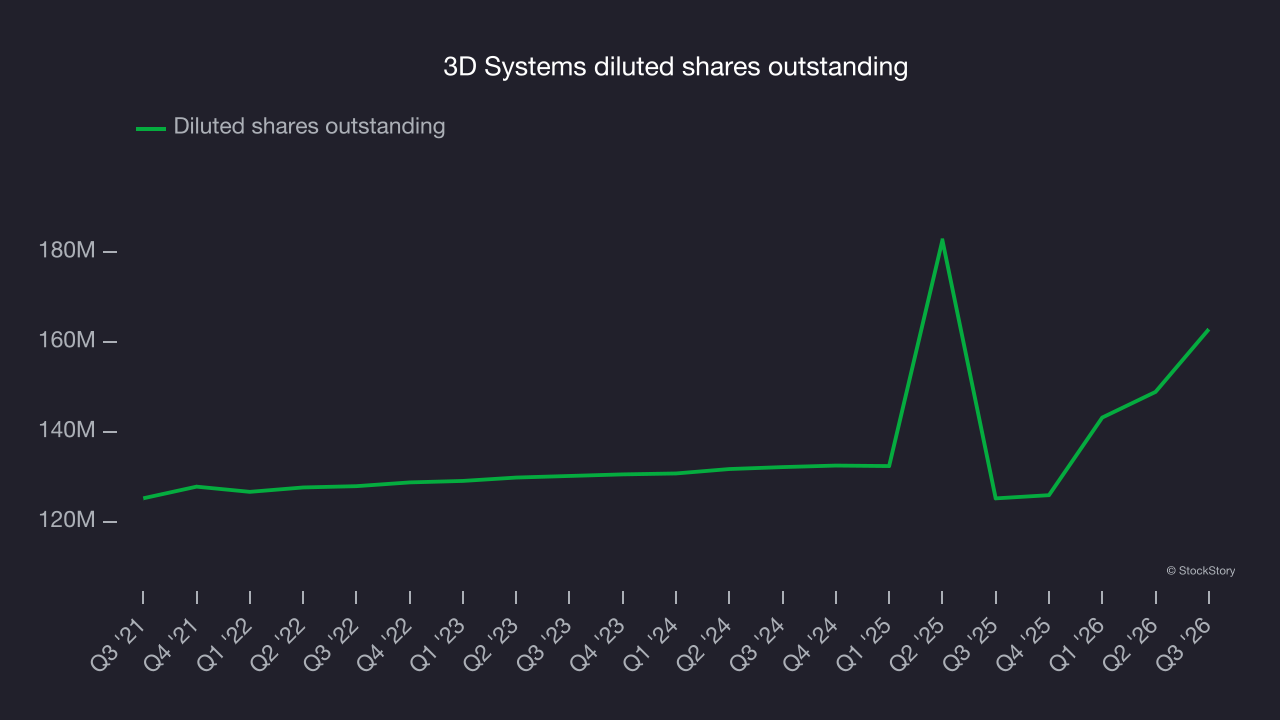
As with revenue, examining EPS over a more recent period can provide insight into an emerging theme or development for the business.
For 3D Systems, its two-year annual EPS growth of 33.3% was higher than its five-year trend. Its improving earnings are a positive sign, but its EPS is still in the red.
In Q3, 3D Systems reported adjusted EPS of negative $0.06, up from negative $0.08 in the same quarter last year. Despite the year-over-year improvement, EPS missed analysts’ consensus estimates. Over the next 12 months, Wall Street expects 3D Systems to narrow its losses. Analysts forecast its full-year EPS will improve from negative $0.24 to negative $0.14, according to S&P.
Key takeaways from 3D Systems’s Q3 results
3D Systems posted revenue above Wall Street’s consensus estimates and a sizable EBITDA beat, but the quarter could have been better: EPS only met expectations, and revenue guidance for next quarter fell short of consensus. Shares remained flat at $2.63 immediately after the results.
For investors considering 3D Systems at its current price, the latest quarter is only one piece of the longer-term business quality picture. Quality, when combined with valuation, can help determine if the stock is a buy. Read the full research report here (it’s free).