

Industrial cleaning equipment manufacturer Tennant Company fell short of the market’s revenue expectations in Q3 2026, but revenue rose 6.3% year on year to $322.3 million. On the other hand, the company’s outlook for the full year was close to analysts’ consensus estimates, with revenue guided to $1.29 billion at the midpoint. Its non-GAAP profit of $1.40 per share was 42.9% above analysts’ consensus estimates.
For more on Tennant, read our free full research report.
Tennant (TNC) Q3 2026 highlights:
- Revenue $322.3 million vs S&P analysts’ consensus estimates of $330.8 million (6.3% year-on-year growth, 2.6% miss)
- Adjusted EPS $1.40 vs S&P analysts’ consensus estimates of $0.98 (42.9% beat)
- Adjusted EBITDA $48.8 million vs analysts’ consensus estimates of $40.38 million (15.1% margin, 20.9% beat)
- Revenue guidance The company reconfirmed its revenue guidance for the full year of $1.29 billion at the midpoint
- Adjusted EPS guidance Management reiterated its full-year adjusted EPS guidance of $4.13 at the midpoint
- EBITDA guidance $162.5 million at the midpoint for the full year, above analysts’ consensus estimates of $150.5 million
- Operating margin 9.7%, up from 7.8% in the same quarter last year
- Free cash flow margin 1.6%, down from 7.3% in the same quarter last year
- Market capitalization $1.13 billion
“"Our third quarter performance demonstrated strong momentum across the business, with orders up 9.5% and record third-quarter net sales, up 6%," said Dave Huml, Tennant President and Chief Executive Officer. "Robotics continues to deliver, with revenue up 71% in the quarter and year-to-date robotics sales already exceeding full-year 2025. Gross margin recovery progressed ahead of expectations and our North America ERP operations continued to improve, though parts shortages continued to impact shipments, contributing to a $118 million backlog exiting the quarter. While we are taking disciplined action to address softer demand in EMEA and APAC, we are encouraged by strong Americas orders, an elevated backlog and continued robotics momentum. As a result, we are reaffirming our full-year guidance."
Revenue growth
Examining a company’s long-term performance can provide clues about its quality. Any business can put up a good quarter or two, but many enduring ones grow for years. Tennant’s revenue grew at a sluggish 2.6% compounded annual growth rate over the last five years, falling short of our benchmarks.
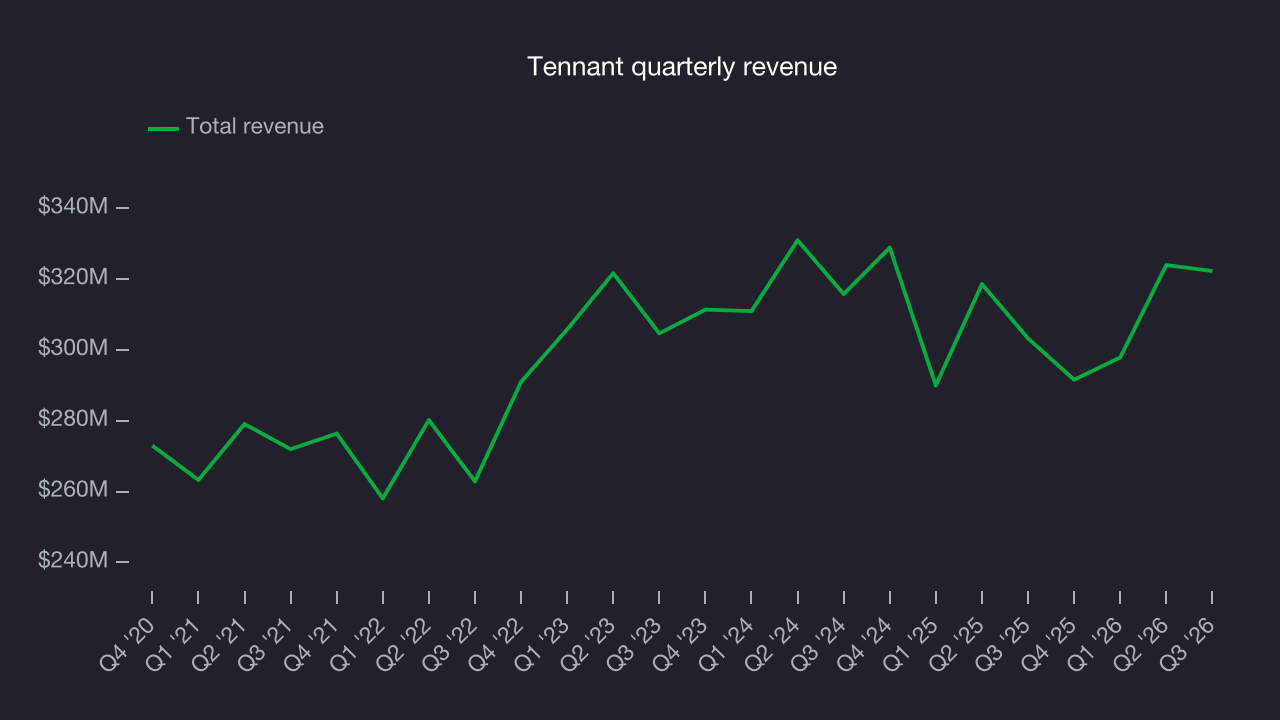
Long-term growth matters most, but within industrials, a half-decade historical view may miss cycles, industry trends or a company capitalizing on catalysts such as a new contract win or a successful product line. Tennant’s performance shows it grew in the past but relinquished its gains over the last two years, as its revenue fell by 1.3% annually. 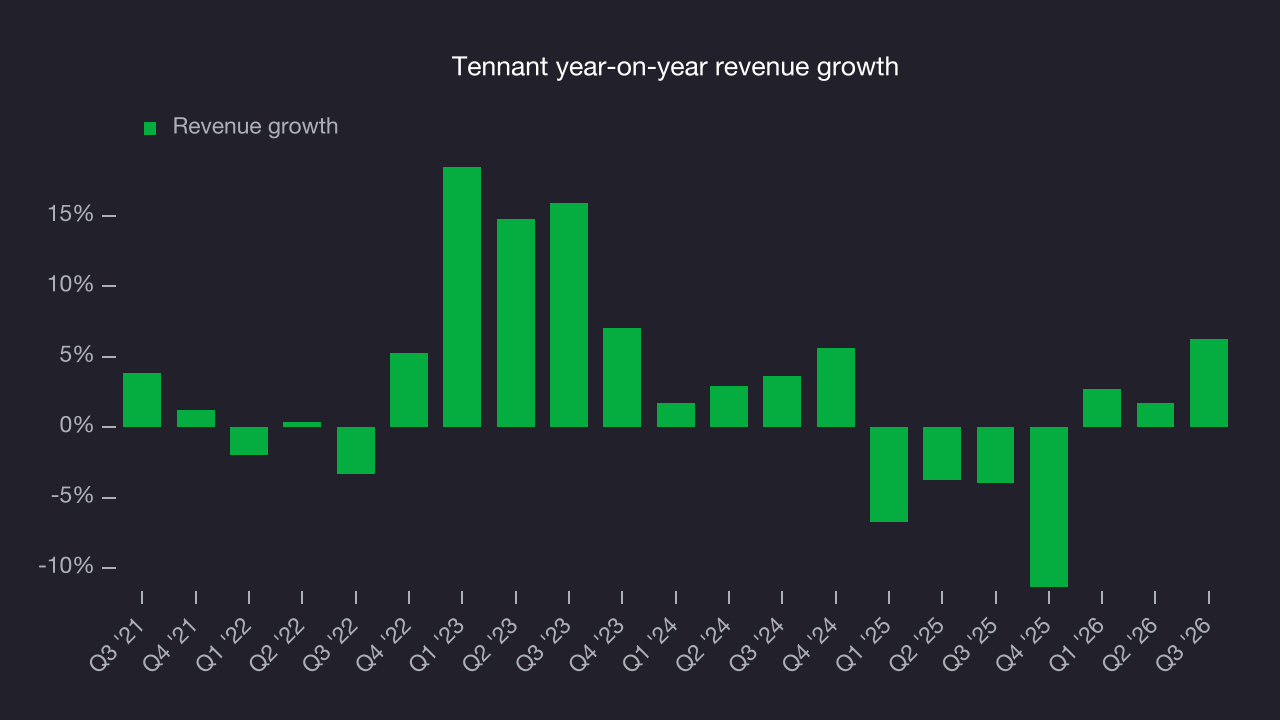
This quarter, Tennant’s revenue grew by 6.3% year on year to $322.3 million, missing Wall Street’s consensus estimates.
Looking ahead, sell-side analysts expect revenue to grow 9% over the next 12 months, according to S&P, an improvement versus the last two years. This projection is above average for the sector and suggests its newer products and services will catalyze better top-line performance.
Operating margin
Tennant has done a decent job managing its cost base over the last five years. The company has produced an average operating margin of 8.2%, higher than the broader industrials sector.
Looking at the trend in its profitability, Tennant’s operating margin decreased by 2.5 percentage points over the last five years. This raises questions about the company’s expense base because its revenue growth should have given it leverage on its fixed costs, resulting in better economies of scale and profitability.
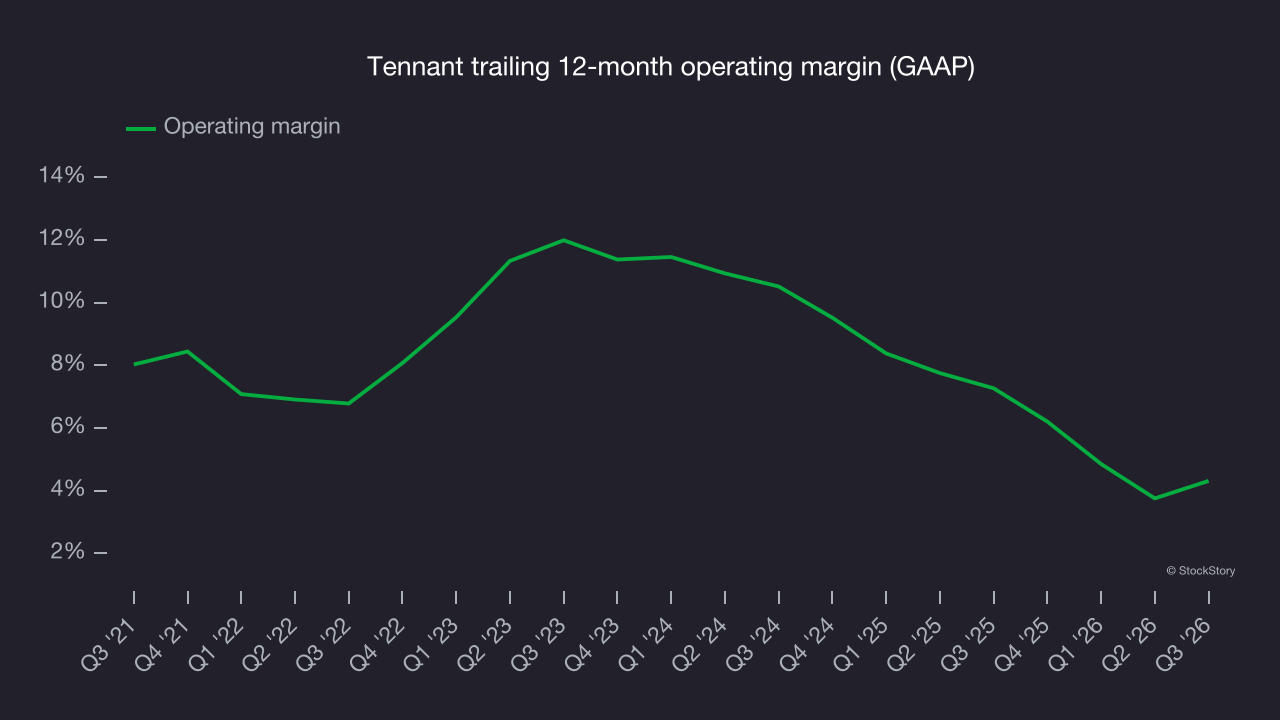
In Q3, Tennant generated an operating margin of 9.7%, up 1.9 percentage points year on year. The increase was a positive sign, and the larger rise in operating margin than in gross margin suggests greater efficiency in expenses such as marketing, R&D and administrative overhead.
Earnings per share
We track the long-term change in earnings per share (EPS) for the same reason as long-term revenue growth. Compared to revenue, however, EPS highlights whether a company’s growth is profitable.
Tennant’s EPS declined by 4.6% annually over the last five years while its revenue grew by 2.6%. This indicates the company became less profitable on a per-share basis as it expanded due to non-fundamental factors such as interest expenses and taxes.
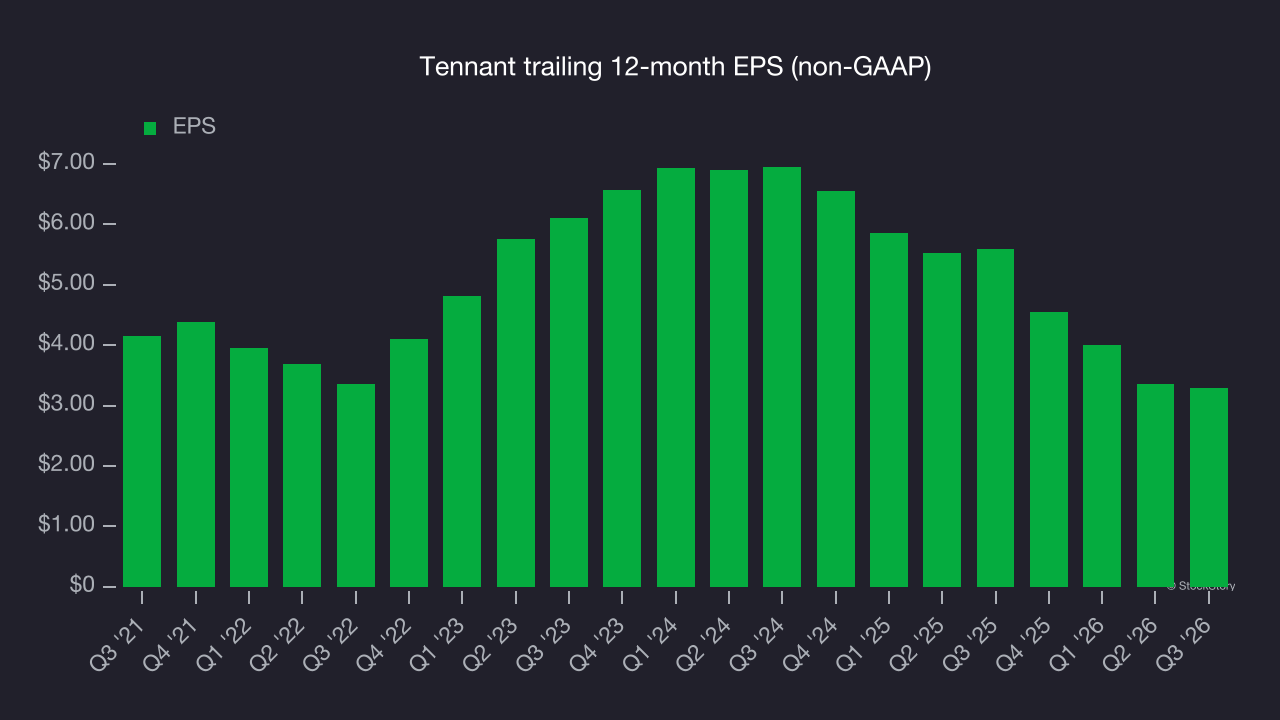
Diving into the nuances of Tennant’s earnings can give us a better understanding of its performance. As we mentioned earlier, Tennant’s operating margin expanded this quarter but declined by 2.5 percentage points over the last five years. This was the most relevant factor (aside from the revenue impact) behind its lower earnings; interest expenses and taxes can also affect EPS but don’t tell us as much about a company’s fundamentals.
Like with revenue, we analyze EPS over a shorter period to see if we are missing a change in the business.
For Tennant, its two-year annual EPS declines of 31.2% show it’s continued to underperform. These results were poor by any measure.
In Q3, Tennant reported adjusted EPS of $1.40, down from $1.46 in the same quarter last year. Despite falling year on year, EPS comfortably beat analysts’ consensus estimates. Over the next 12 months, Wall Street expects Tennant’s full-year EPS to grow 62.4% from $3.29 to $5.34, according to S&P.
Key takeaways from Tennant’s Q3 results
Earnings were the highlight of Tennant’s decent quarter: EPS beat analysts’ consensus estimates, and EBITDA topped Wall Street’s consensus by a wide margin. Revenue, however, missed expectations. Shares remained flat at $68.78 immediately after the release.
For investors considering Tennant, the latest quarter is only one piece of the longer-term business quality puzzle. Quality, combined with valuation, can help determine whether the stock is worth buying. For more on Tennant, read the full research report here (it’s free).