

Landscaping service company BrightView (NYSE:BV) fell short of the market’s revenue expectations in calendar Q3 2026 (fiscal Q4 2026), with revenue falling 3.6% year on year to $677.3 million. The company’s full-year revenue guidance of $2.63 billion at the midpoint came in 4.9% below analysts’ consensus estimates. Its non-GAAP profit of $0.18 per share was 29.5% below analysts’ consensus estimates.
For more on BrightView, read our free full research report.
BrightView (BV) Q3 CY2026 highlights:
- Revenue $677.3 million vs S&P analysts’ consensus estimates of $723.5 million (3.6% year-on-year decline, 6.4% miss)
- Adjusted EPS $0.18 vs S&P analysts’ consensus estimates of $0.26 (29.5% miss)
- Adjusted EBITDA $100.3 million vs analysts’ consensus estimates of $113.3 million (14.8% margin, 11.5% miss)
- EBITDA guidance $345 million at the midpoint for fiscal 2027, below analysts’ consensus estimates of $373.1 million
- Operating margin 4.9%, down from 7.9% in the same quarter last year
- Market capitalization $1.10 billion
“We closed fiscal 2026 with our third consecutive quarter of Land Maintenance revenue growth,” said Dale Asplund, BrightView President and Chief Executive Officer. “The underlying growth rate accelerated each quarter, reaching 3.3% in the fourth quarter, as improved customer retention and continued investment in our salesforce supported momentum in this highly recurring and predictable segment. For the full year, revenue increased 1.5%, and excluding the impact of non-routine items, Adjusted EBITDA improved modestly. Despite the macroeconomic environment driving softness in our Development business, we remain highly encouraged by the continued improvement in our foundational KPIs and remain focused on delivering long-term profitable growth and shareholder value. We enter fiscal 2027 expecting 3% to 4% growth in our recurring Land Maintenance business and a return to Adjusted EBITDA margin expansion, a testament to the progress we’ve made since the beginning of our transformation.”
Revenue growth
A company’s long-term revenue performance can indicate its overall quality. Any business can report a good quarter or two, but the best consistently grow over the long haul. BrightView’s revenue grew at a sluggish 1.2% annualized rate over the last five years, falling short of our benchmarks.
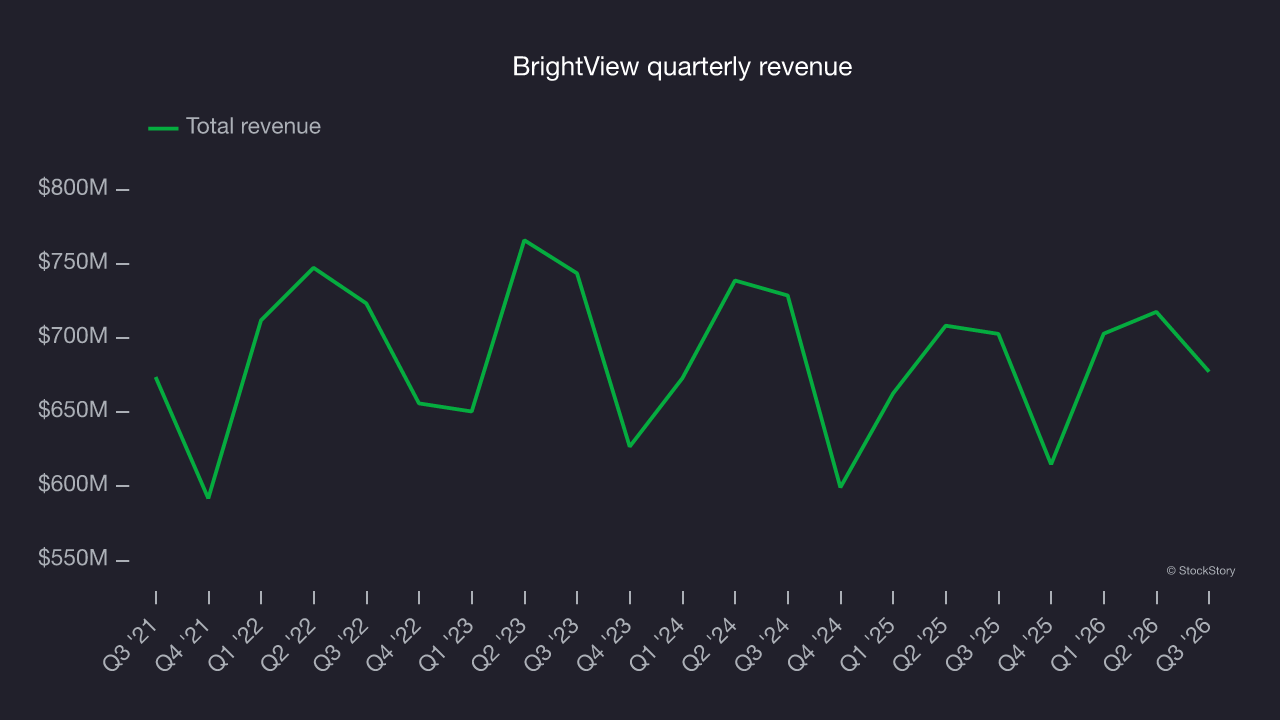
Long-term growth matters most, but within industrials, a half-decade historical view may miss cycles, industry trends or a company capitalizing on catalysts such as a new contract win or a successful product line. BrightView’s recent performance shows its demand has slowed as its revenue was flat over the last two years.
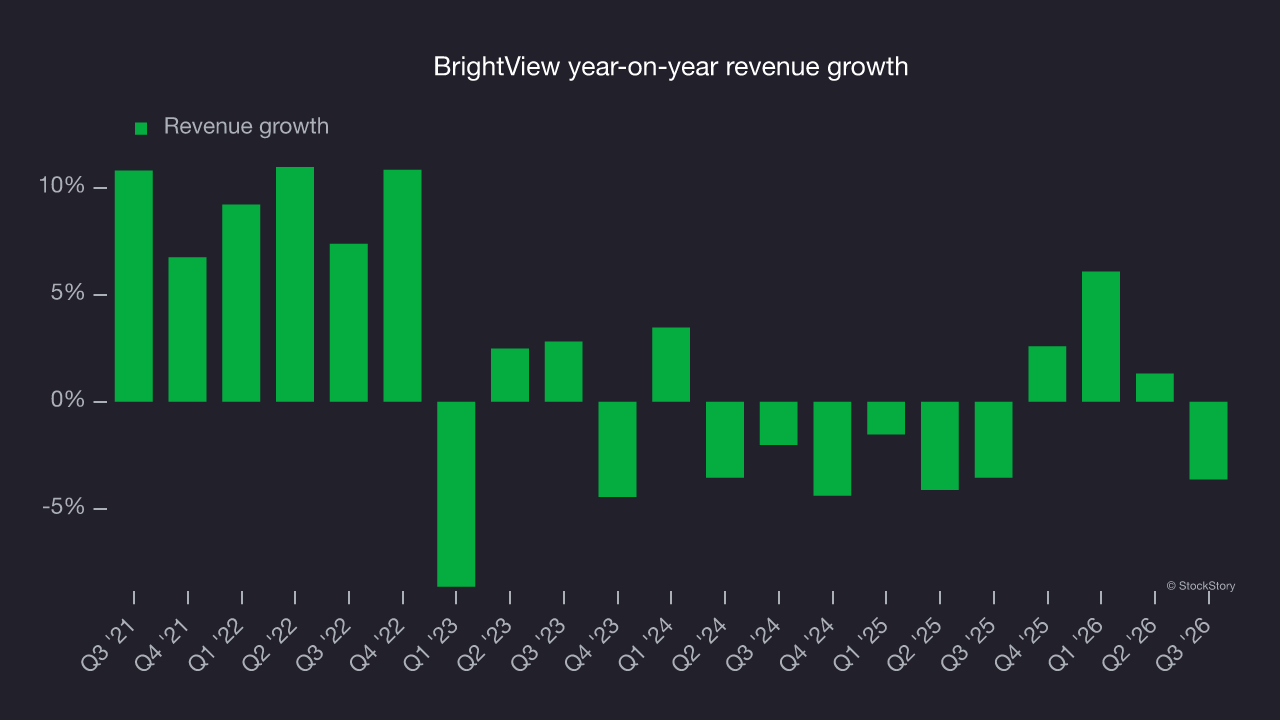
This quarter, BrightView missed Wall Street’s consensus estimates and reported an uninspiring 3.6% year-on-year revenue decline, generating $677.3 million of revenue.
Looking ahead, sell-side analysts expect revenue to grow 1.7% over the next 12 months, according to S&P. Although this projection indicates its newer products and services will drive better revenue performance, it is still below the sector average.
Operating margin
Operating margin is one of the best measures of profitability because it shows how much money a company earns after procuring and manufacturing its products, marketing and selling those products and, most importantly, keeping them relevant through research and development.
BrightView’s operating margin was broadly unchanged over the last five years. Its costs have broadly tracked its revenue, leaving its long-term profitability largely unchanged. Its trailing 12-month operating margin was 2.8%.
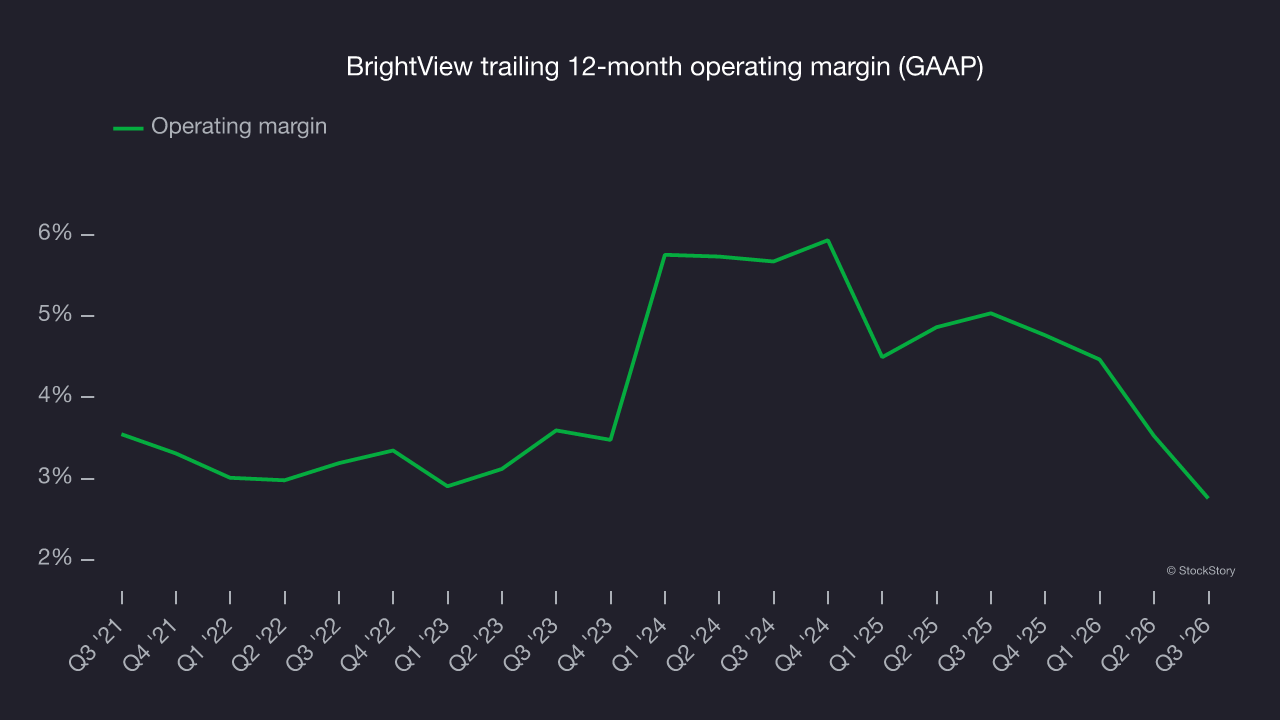
In Q3, BrightView generated an operating profit margin of 4.9%, down 2.9 percentage points year on year. Since BrightView’s gross margin decreased more than its operating margin, this suggests its recent inefficiencies were driven more by weaker leverage on its cost of sales than by increased spending on marketing, research and development and administrative overhead.
Earnings per share
Revenue trends explain a company’s historical growth, but the long-term change in earnings per share (EPS) points to the profitability of that growth. For example, a company could inflate its revenue through excessive spending on advertising and promotions.
BrightView’s EPS declined by 18.6% annually over the last five years while its revenue grew by 1.2%. However, its operating margin didn’t change during this time, indicating that non-fundamental factors such as interest and taxes affected its ultimate earnings.
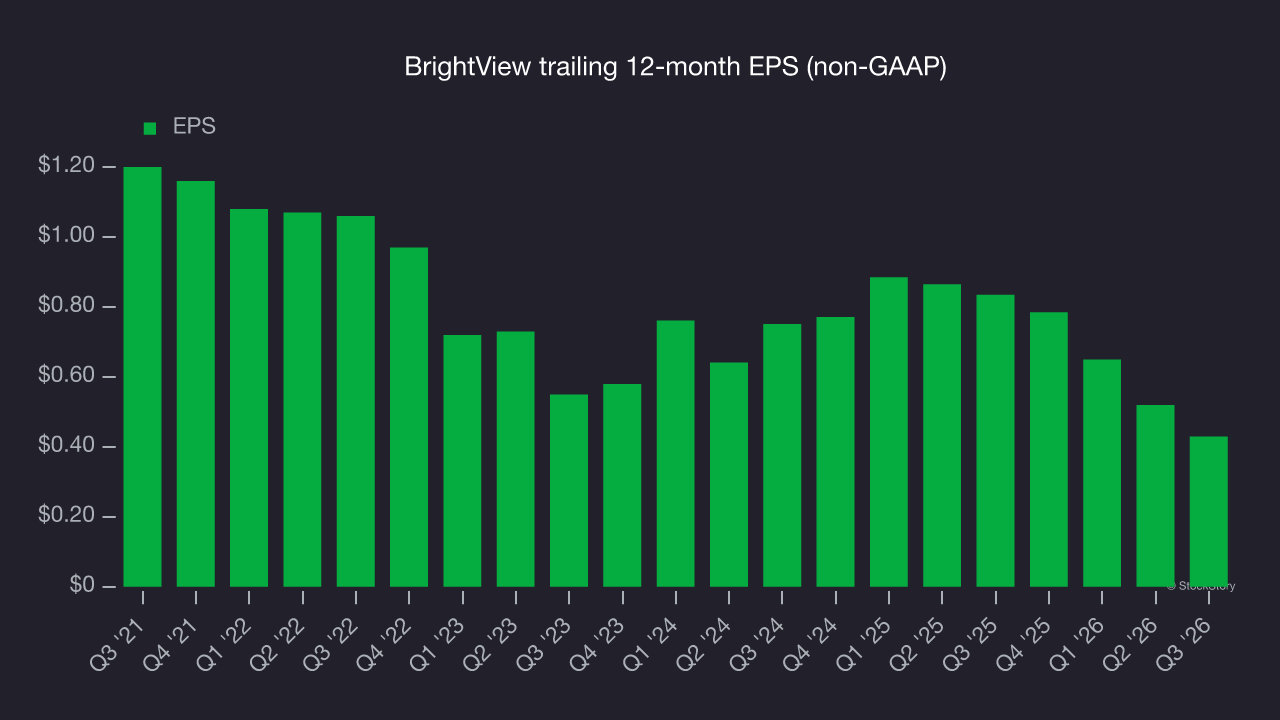
Like with revenue, we analyze EPS over a more recent period because it can provide insight into an emerging theme or development for the business.
BrightView’s EPS declined at a poor annual rate of 24.4% over the last two years, trailing its flat revenue.
Diving into the nuances of BrightView’s earnings can give us a better understanding of its performance. BrightView’s operating margin has declined over the last two years. This was the most relevant factor (aside from the revenue impact) behind its lower earnings; interest expenses and taxes can also affect EPS but don’t tell us as much about a company’s fundamentals.
In Q3, BrightView reported adjusted EPS of $0.18, down from $0.27 in the same quarter last year. This result missed analysts’ consensus estimates. Over the next 12 months, Wall Street expects BrightView’s full-year EPS to grow 41% from $0.43 to $0.61, according to S&P.
Key takeaways from BrightView’s Q3 results
BrightView’s full-year outlook offered little to like: Revenue guidance missed expectations, and EBITDA guidance also fell short of Wall Street’s consensus. That made this a weaker quarter overall. Shares plunged 15.2% to $9.68 immediately after the results.
BrightView may have had a tough quarter, but does that create an investment opportunity? That decision requires considering its valuation, business quality and latest results. For more on BrightView, read our full research report here (it’s free).